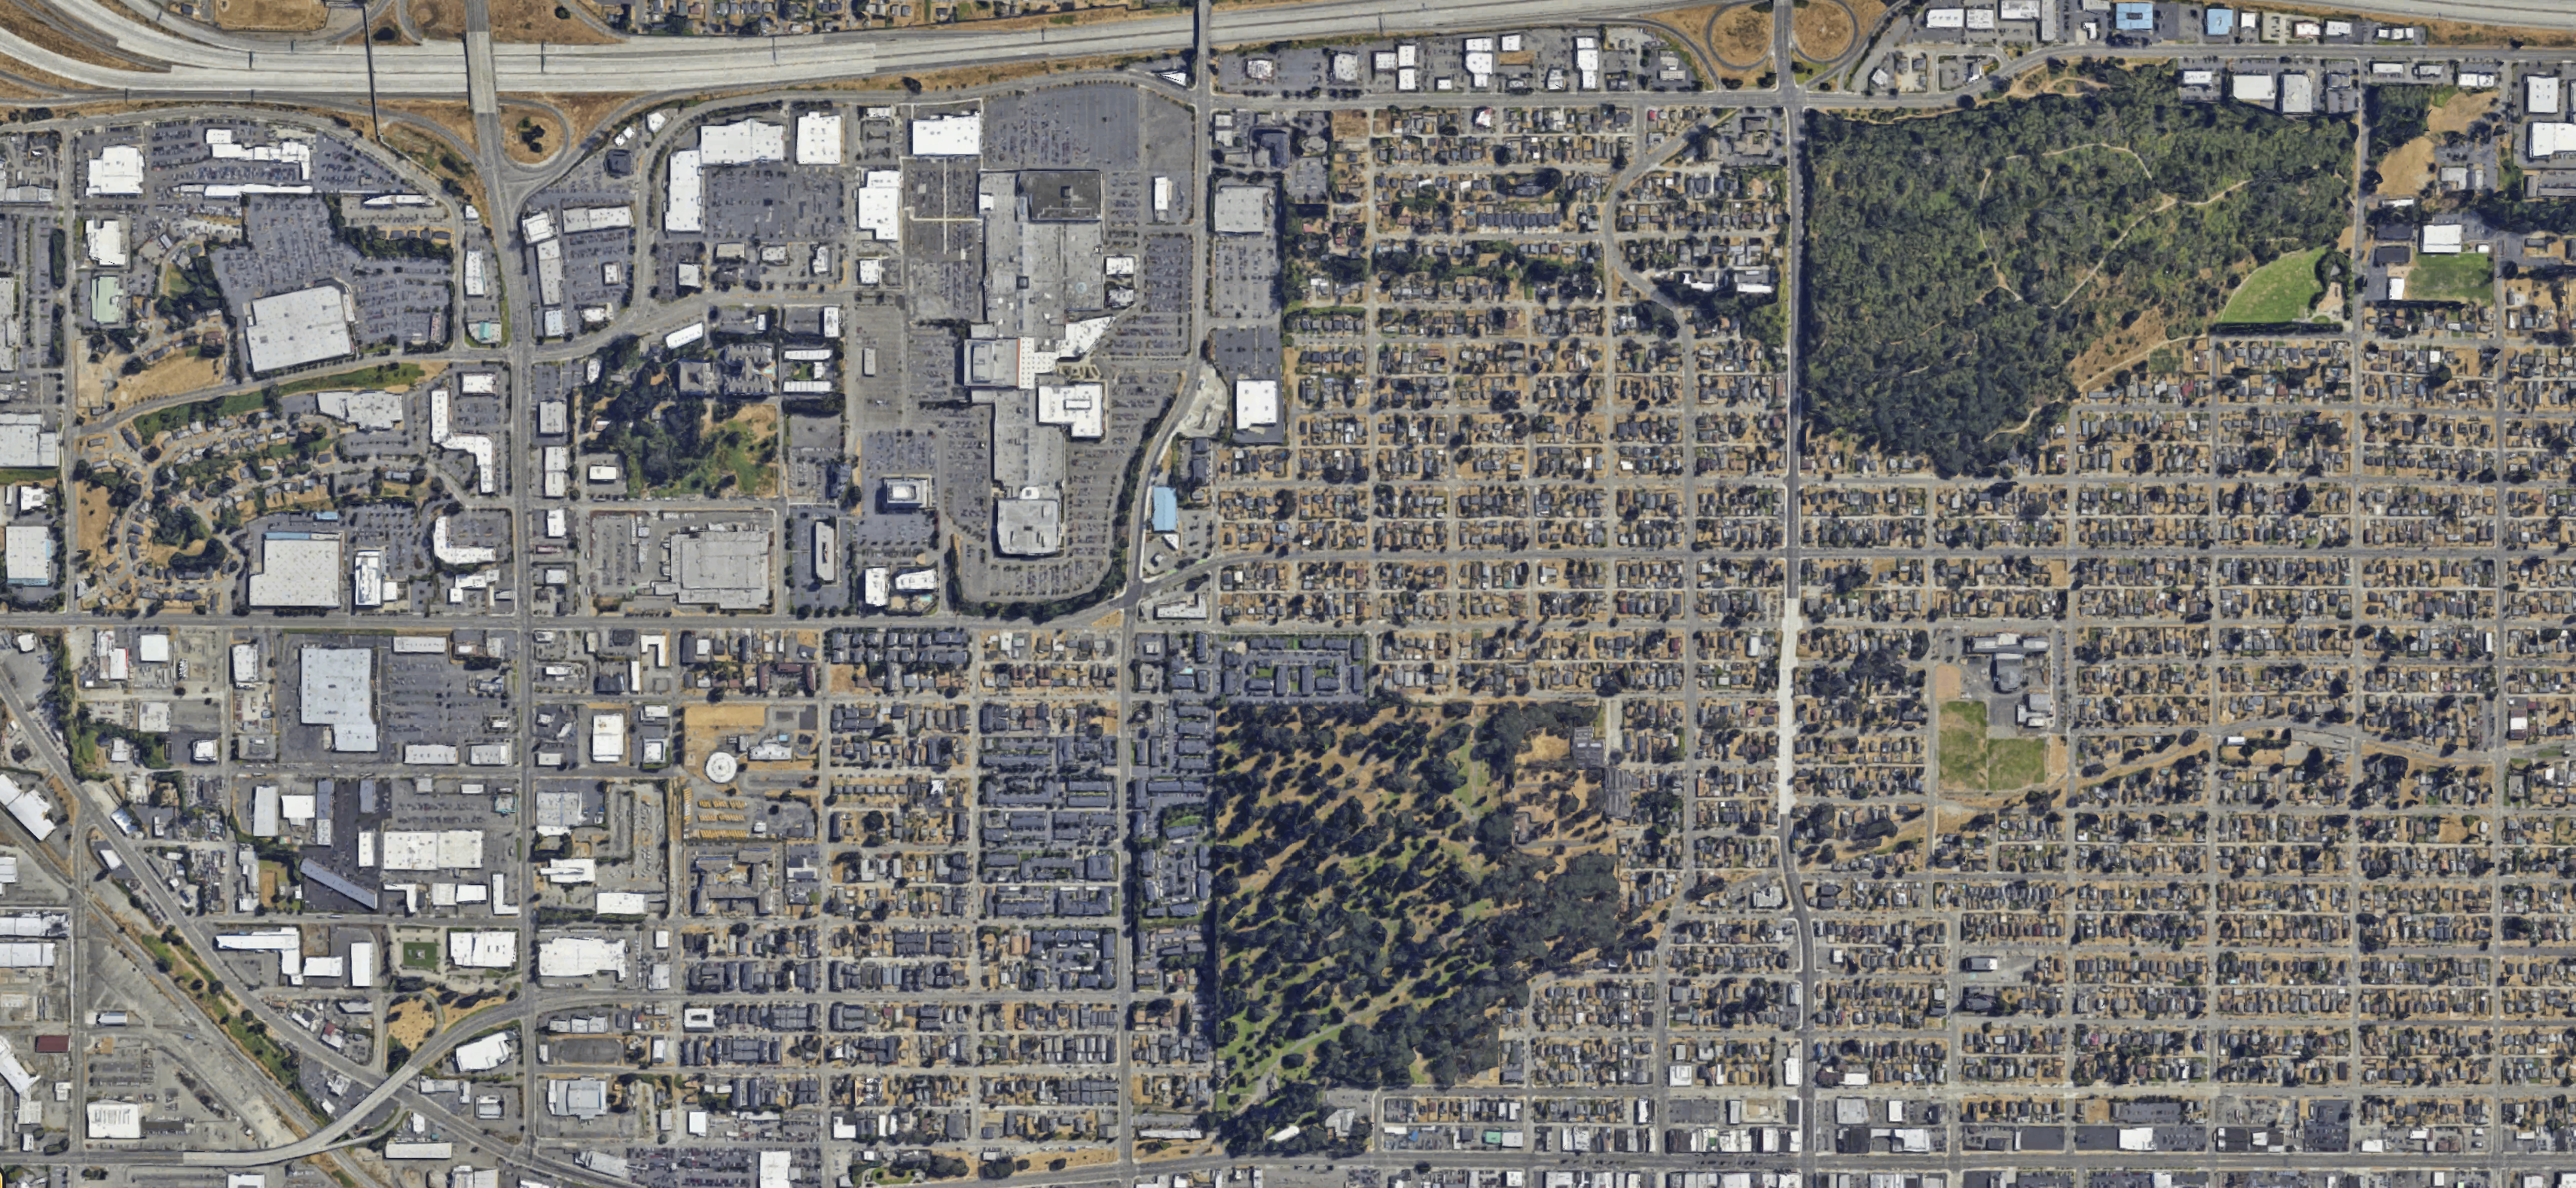
This project, run in collaboration with The Nature Conservancy and the Tacoma Tree Foundation, focused on assessing the efficacy of tree coverage at reducing temperatures in
urban environments. It began with several dozen community scientists collecting temperature data in
predetermined locations 3 separate times over the course of a single day in August of 2022.
Following data collection, the data submissions were then cleaned and standardized using Python.
After standardization, the newly cleaned data was analyzed and visualized also using Python.
This analysis allowed key insights not only into the primary scientific goal of examining the effect that tree canopies have on urban temperatures, but also into how subsequent data collections could be improved.
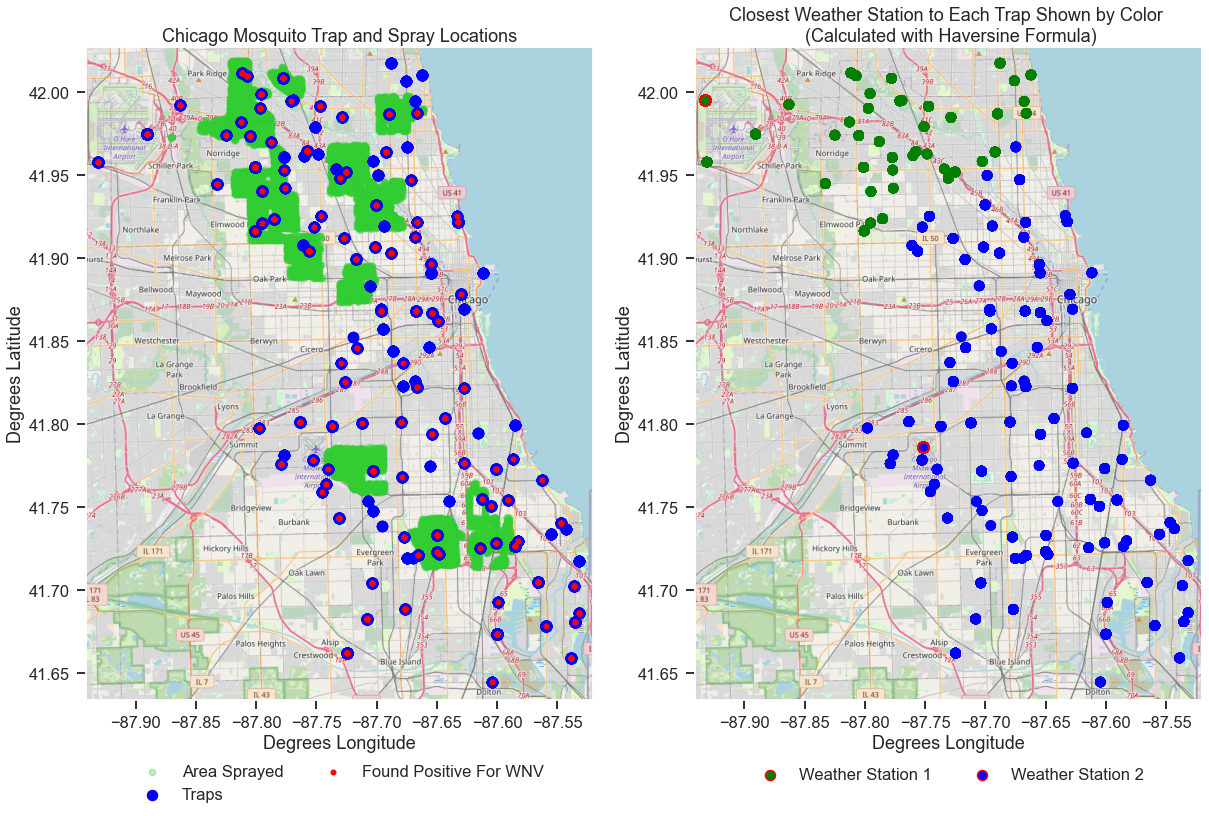
This project explored the history of West Nile Virus in Chicago. It joins multiple datasets and explores the relationship between weather, mosquito population, and West Nile Virus prevalence.
Data is cleaned and explored in a Python notebook
and then visualized in Tableau.
Excel, MySQL, and Tableau
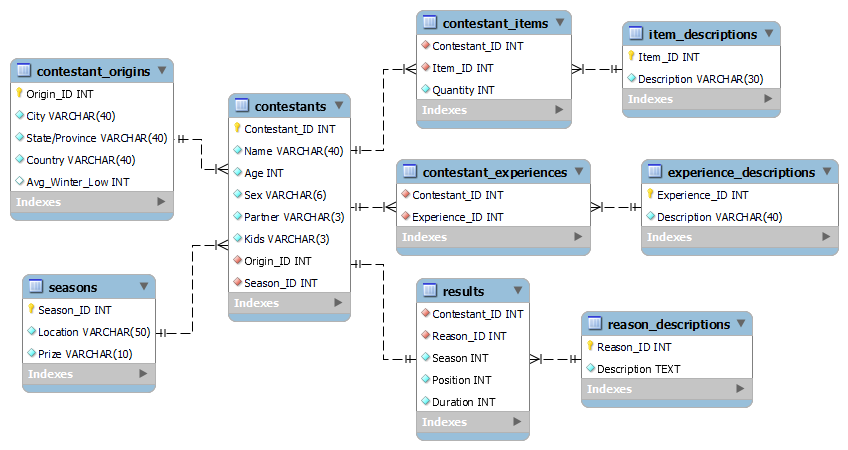
This Alone database and subsequent presentation was sourced, created, and standardized
solely through information available online and from the TV show itself.
It was initially created using Excel and
later collated into a SQL database using MySQL Workbench.
The data was then interrogated and presented using
Tableau.
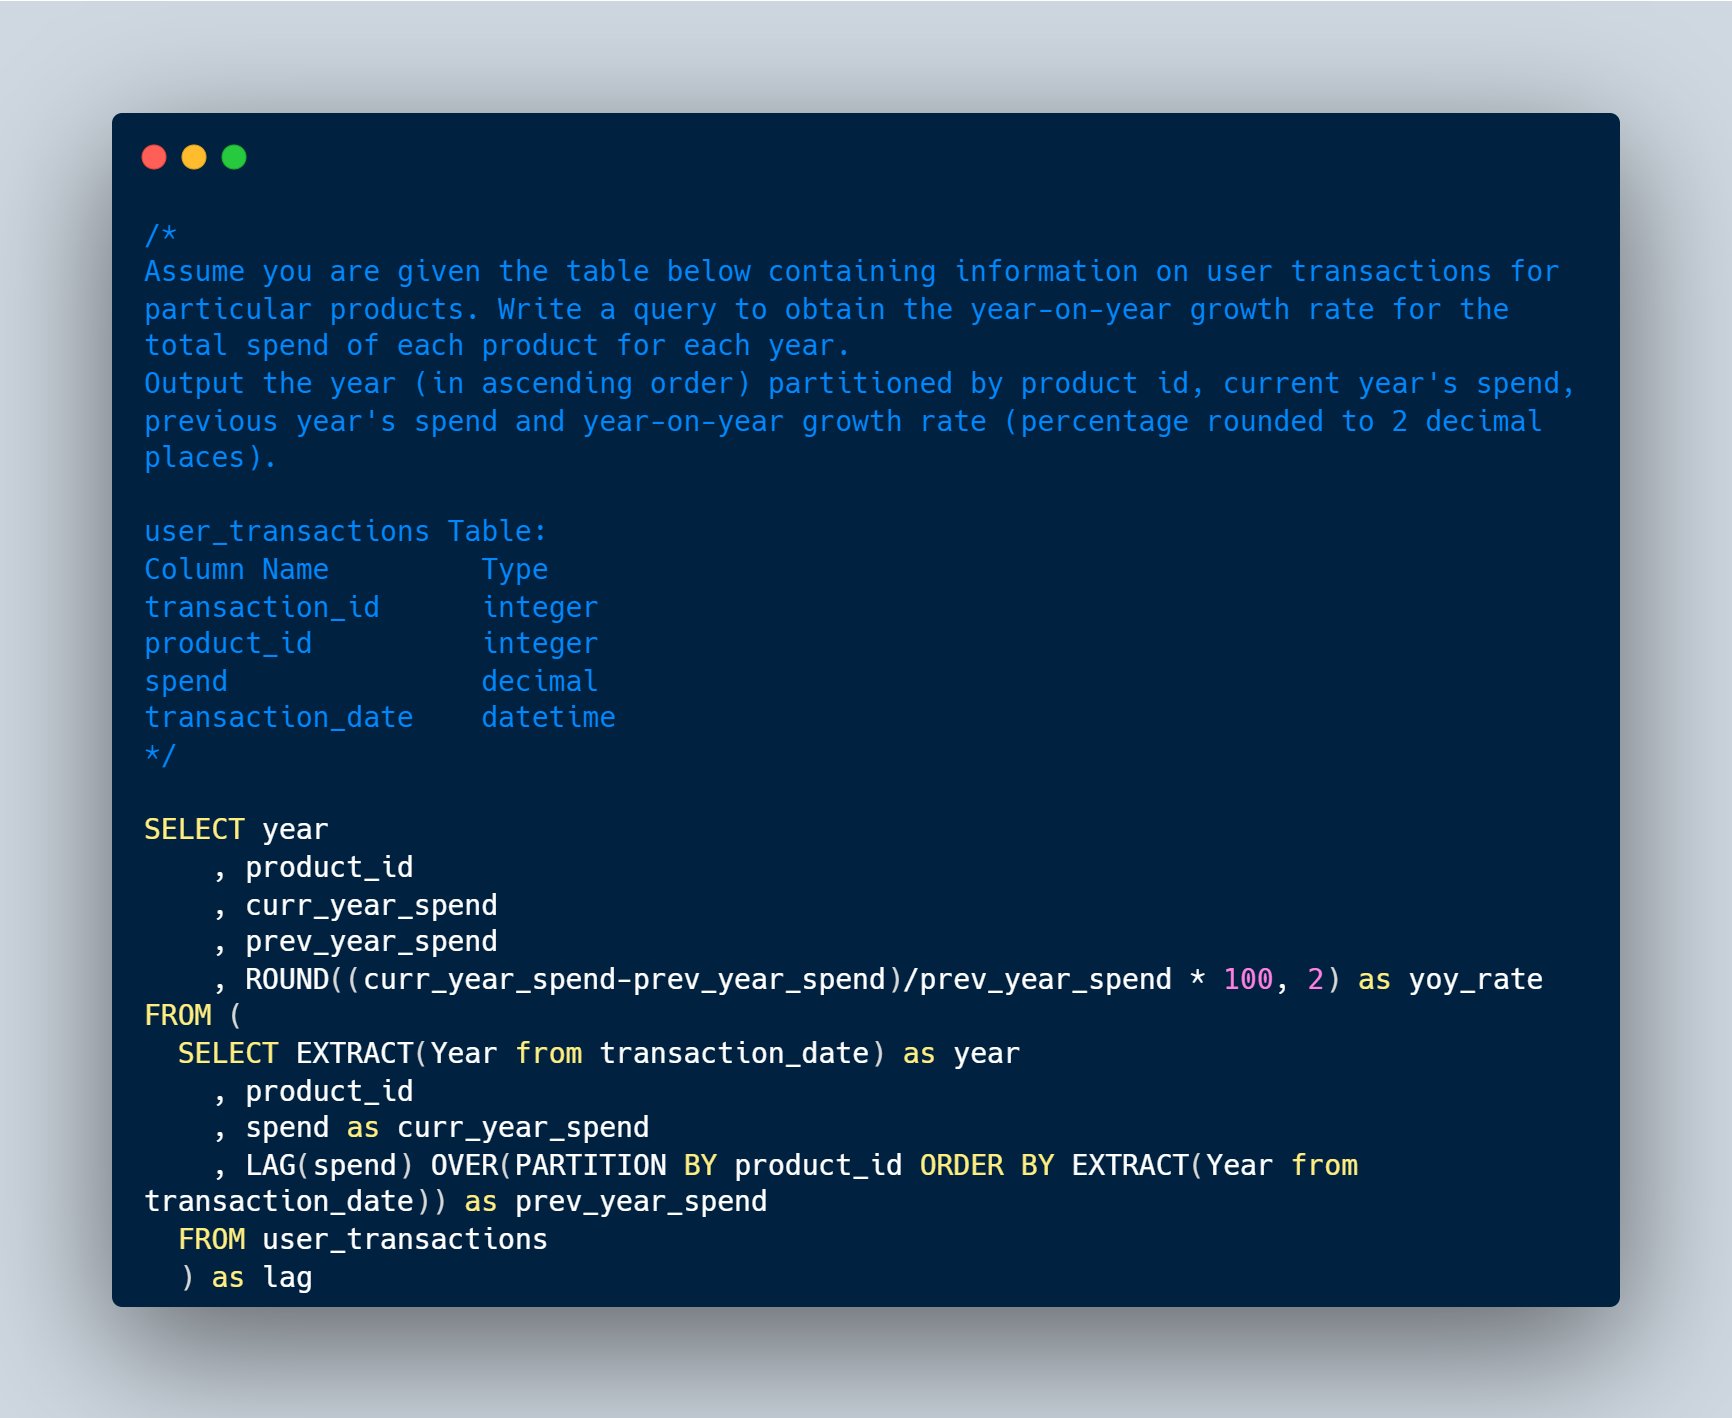
This repository combines SQL challenges from a variety of online SQL challenge websites. It is sorted first by challenge origin and then, if applicable, by difficulty.
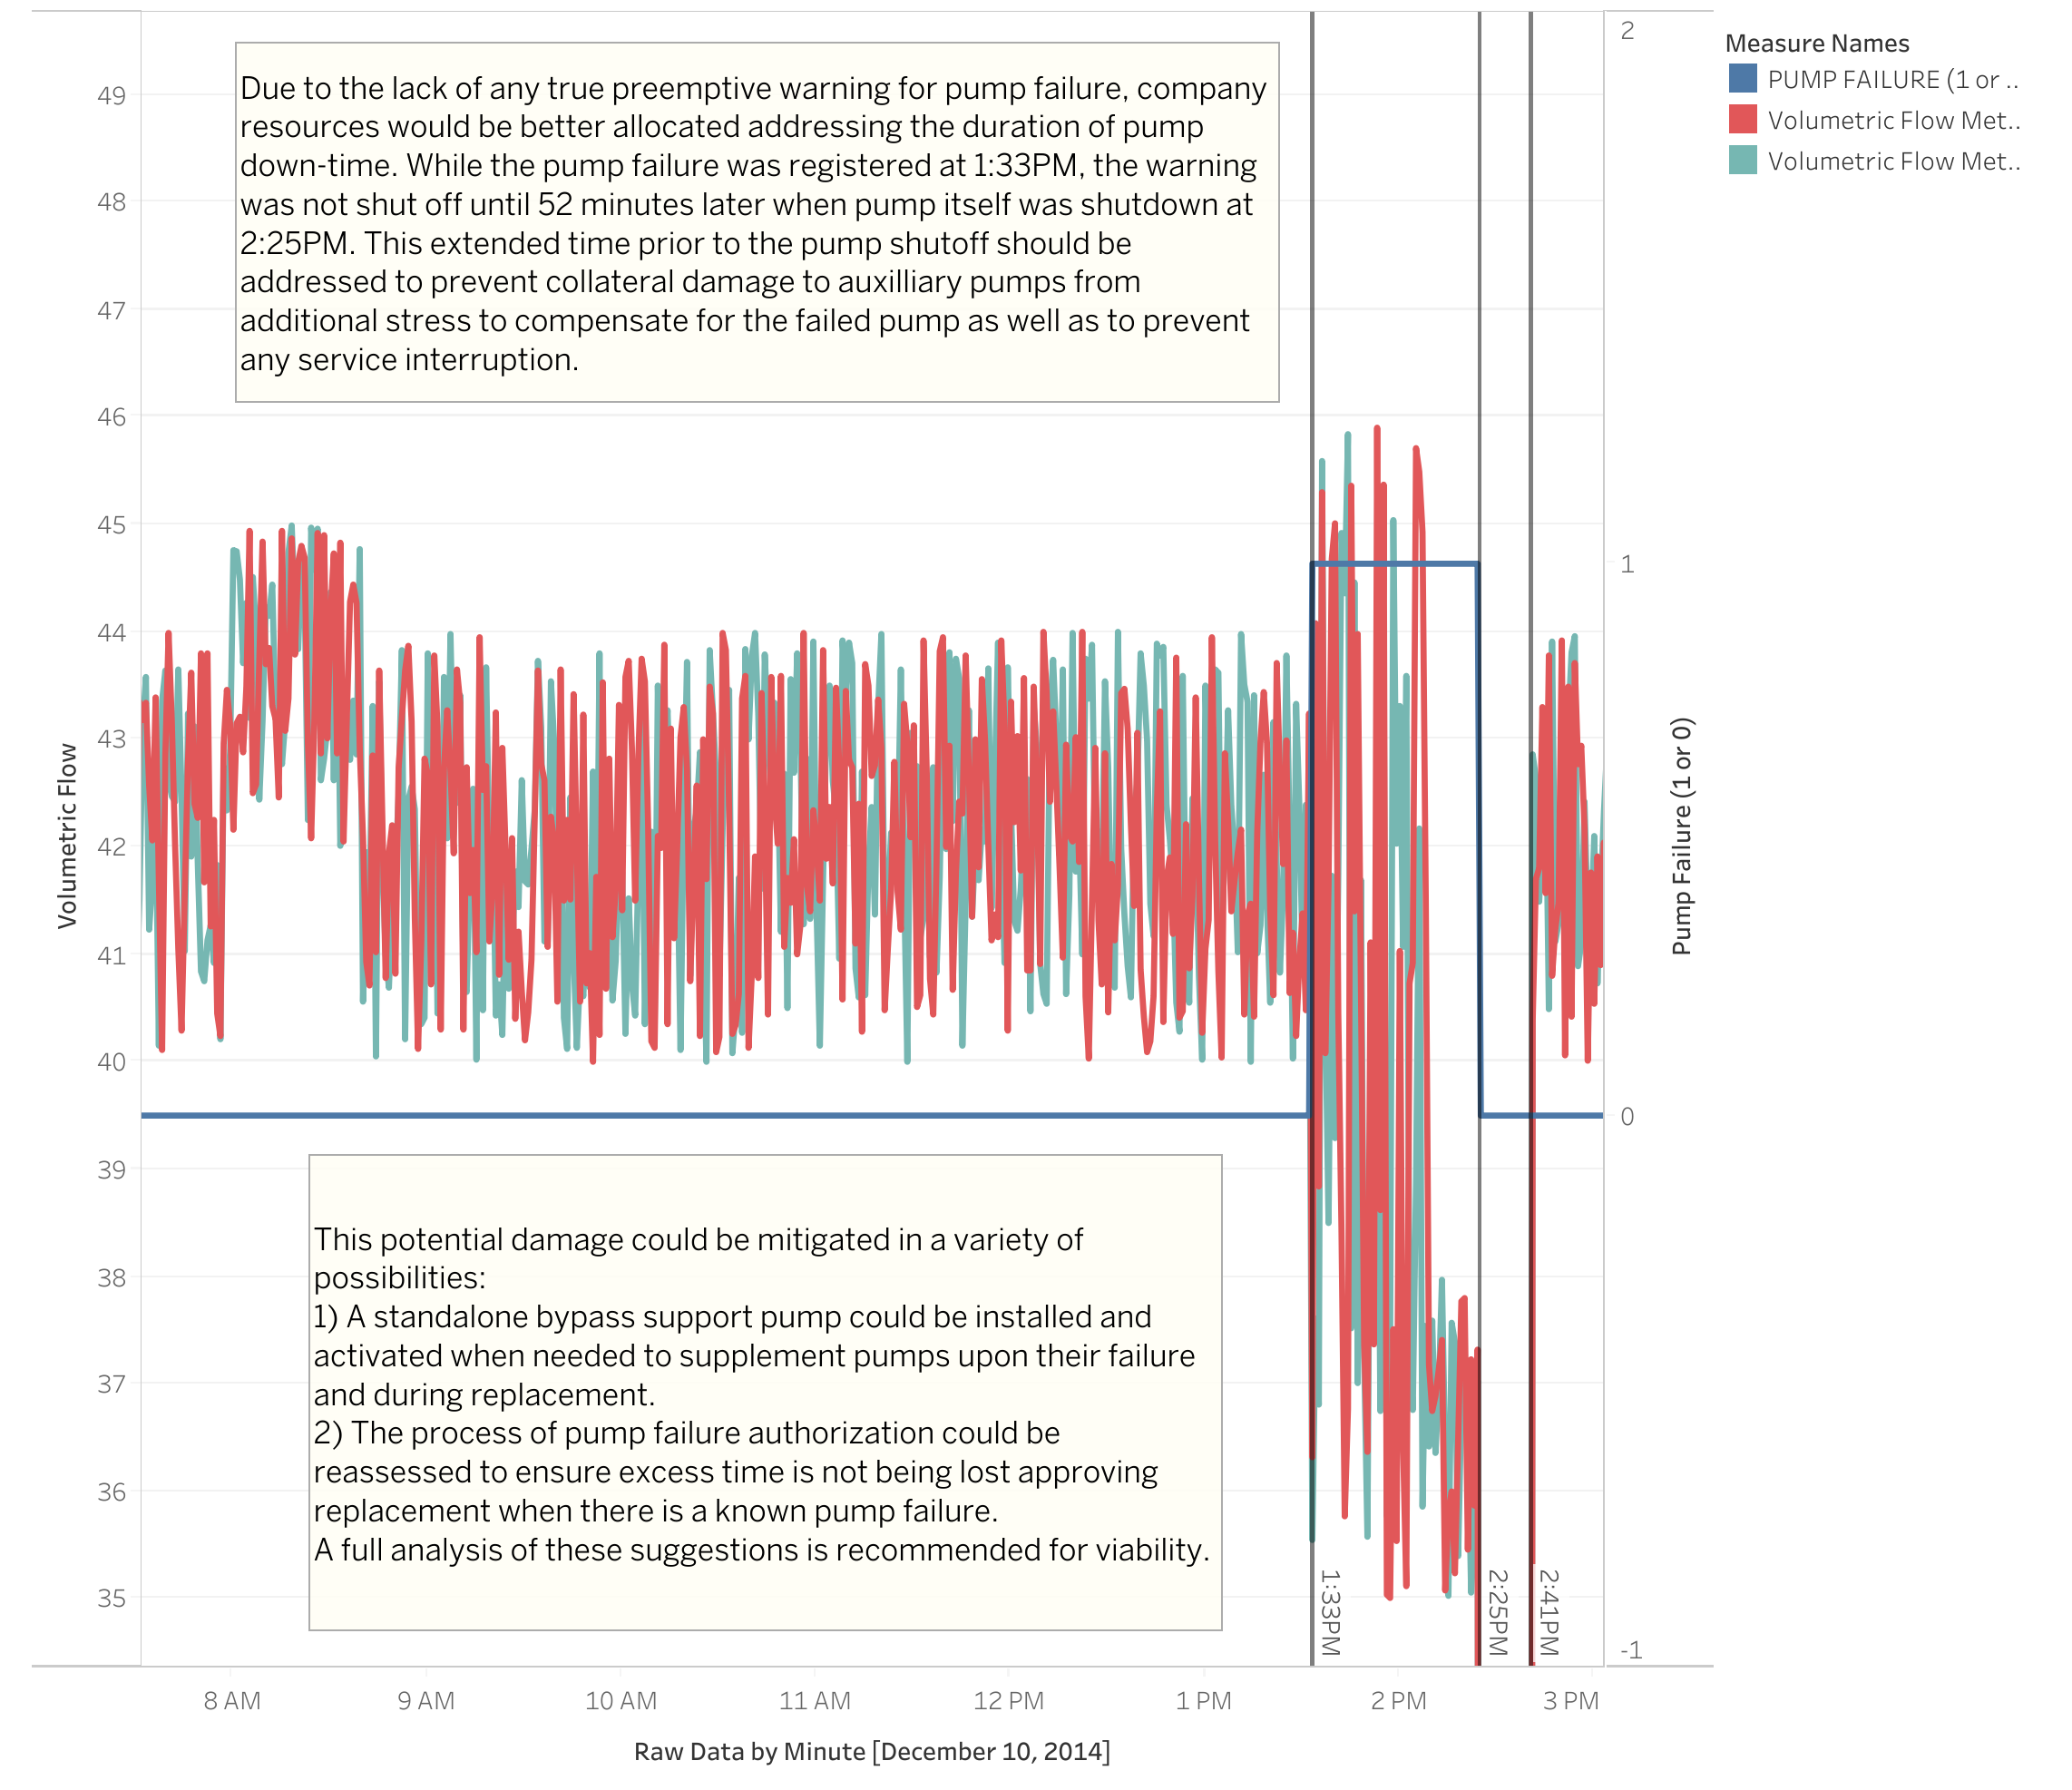
This project was based on a Springboard assignment that asked students to use 30-minute rolling mean values to predict pump failure.
This presentation
explored the flaws of this methodology and goes on to suggest alternate courses of action in the absence of any true predictor.