West Nile Virus in Chicago

Photo by Lewis Carlyle
Combining data sources
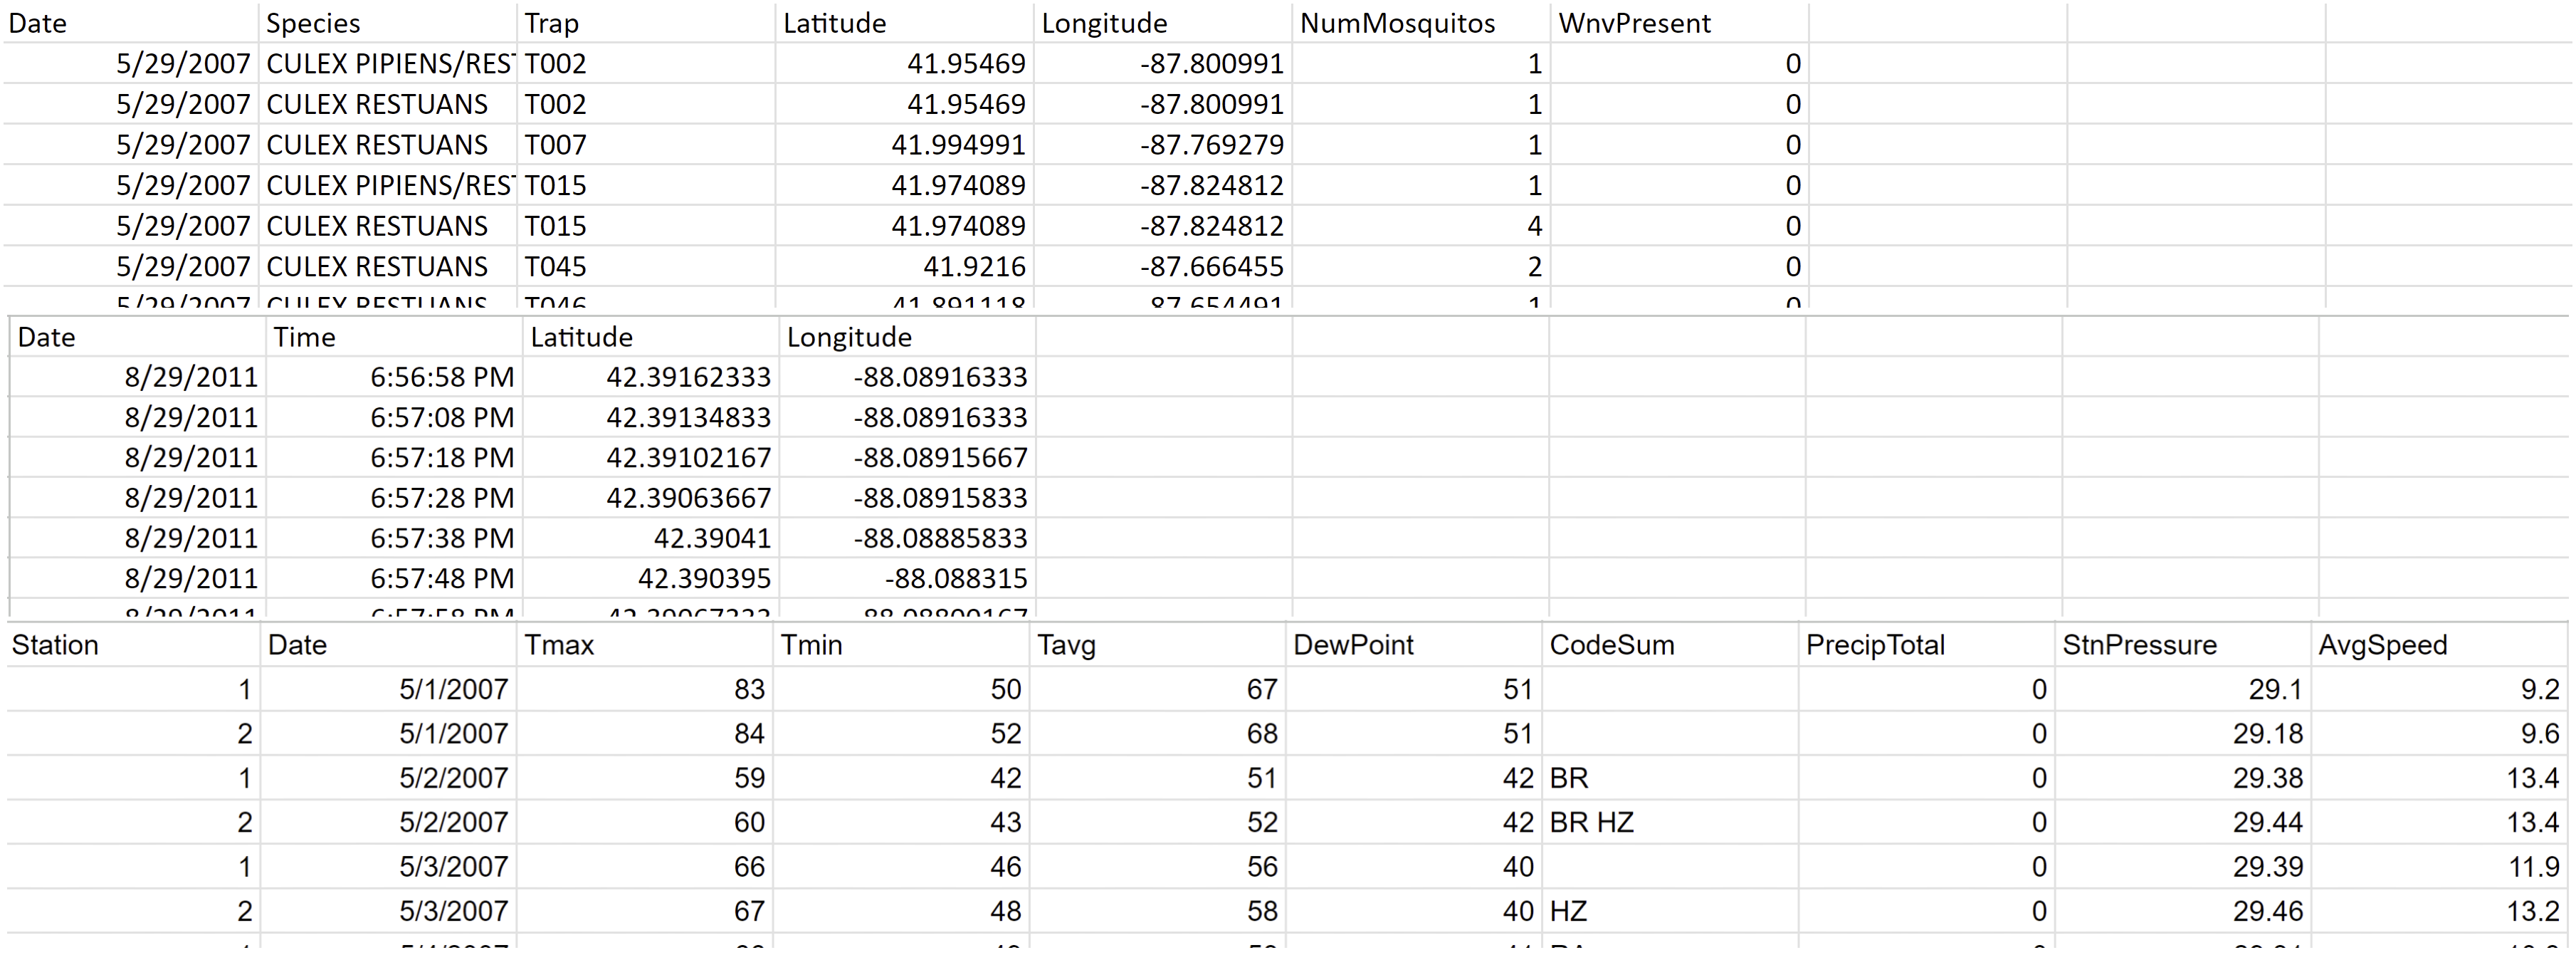
This project began by combining 3 separate CSV files sourced from a data analysis competition hosted by Kaggle in 2015. The first is a CSV that shows the results of mosquito trap inspections. This file includes a total count of mosquitoes, the trap location, the mosquito species, and whether or not West Nile Virus was found present in any of these mosquitoes. Each trap was checked around once per week. The second CSV includes weather information for the greater Chicago Area sourced from 2 distinct weather stations: one at Chicago's O'hare Airport and one at Chicago's Midway Airport. The final CSV details pesticide spray information carried out by the Illinois Department of Public Health. This CSV includes minute by minute location data from a GPS device worn by the person doing the spraying.
Data provided here
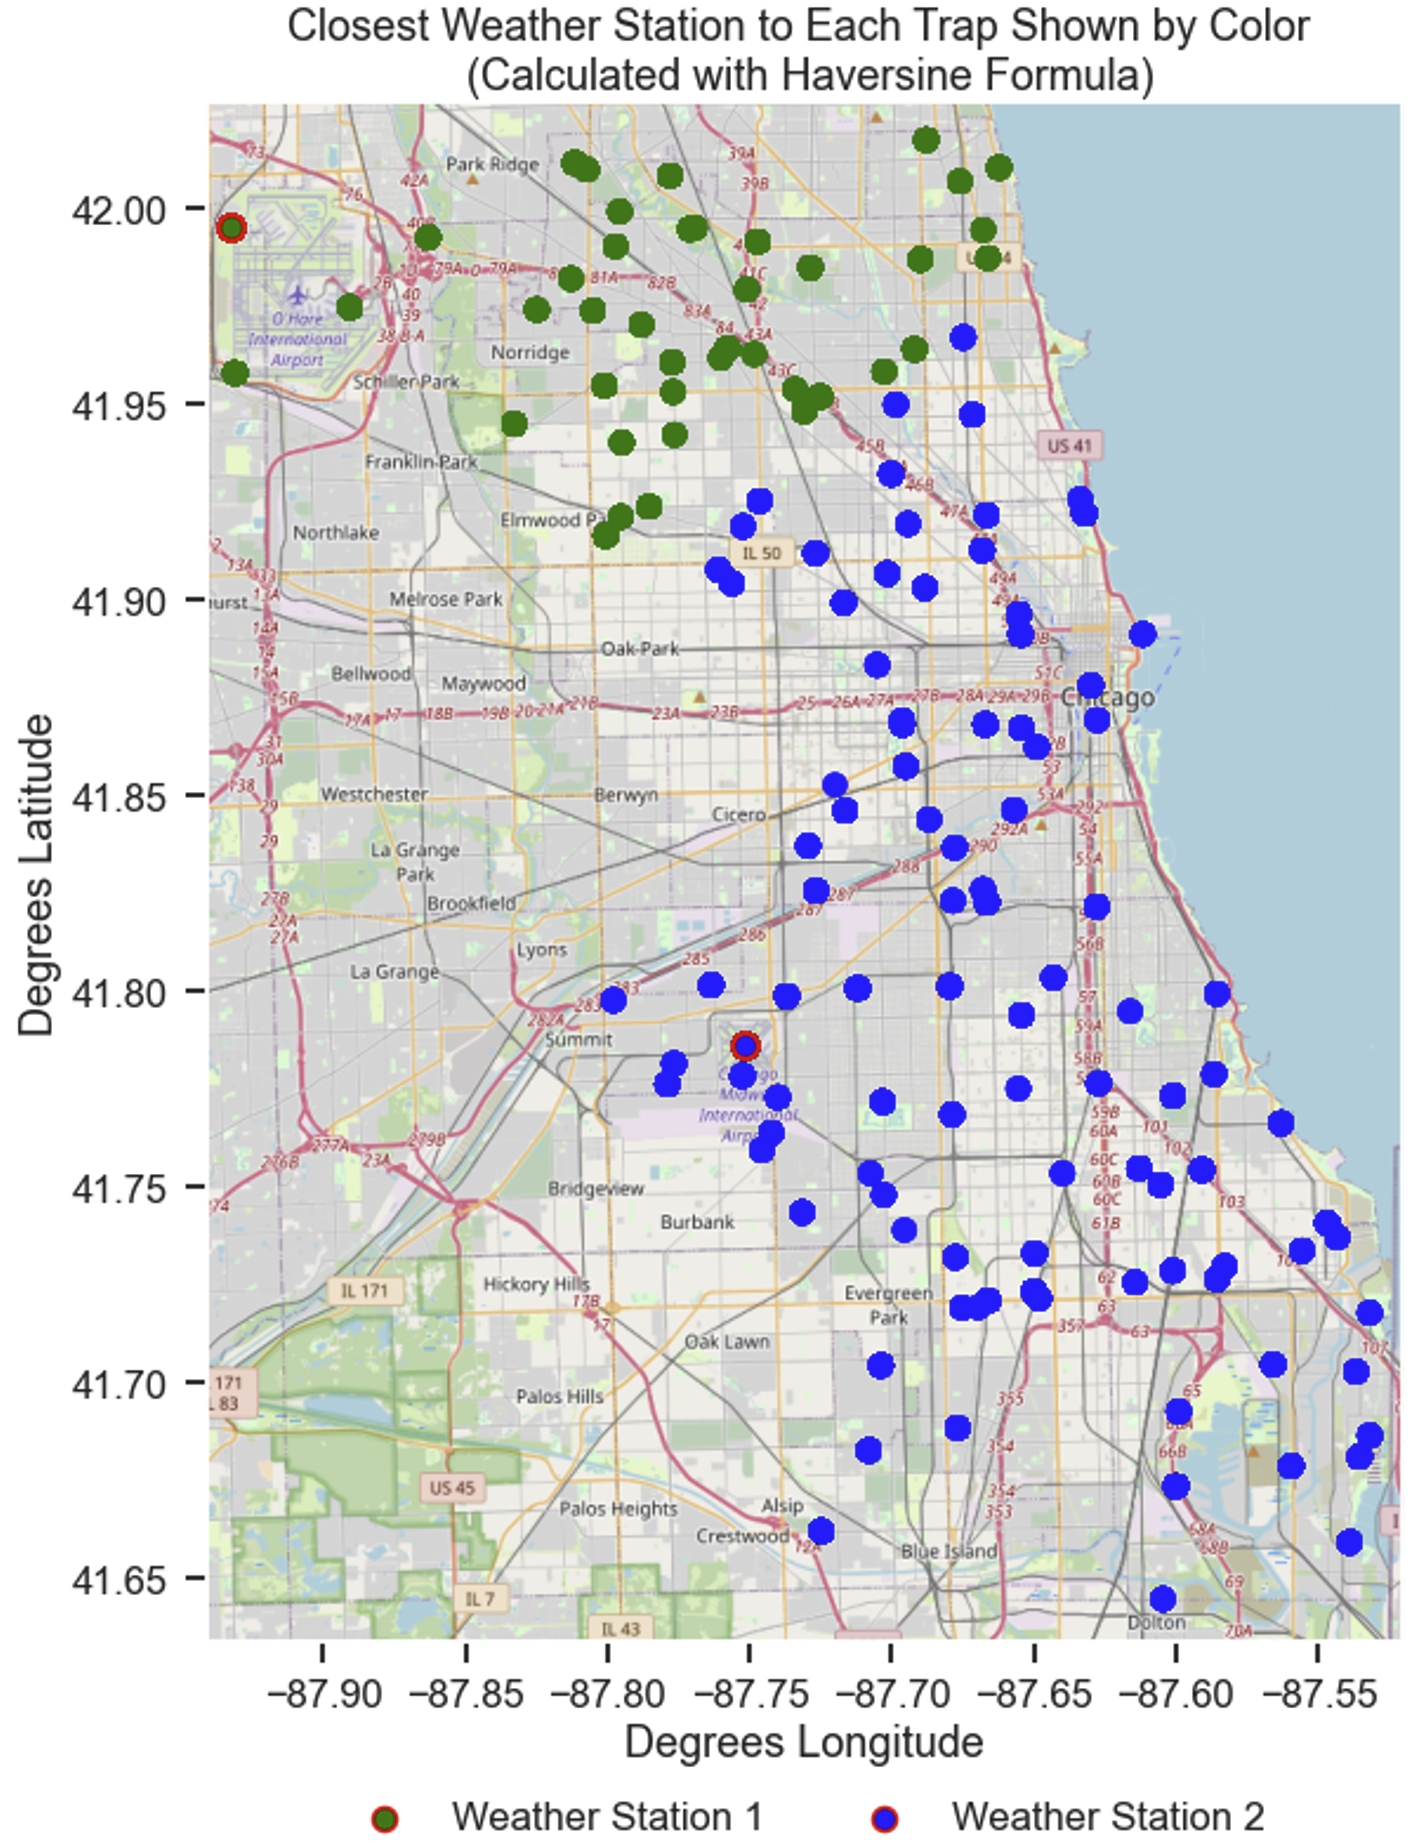
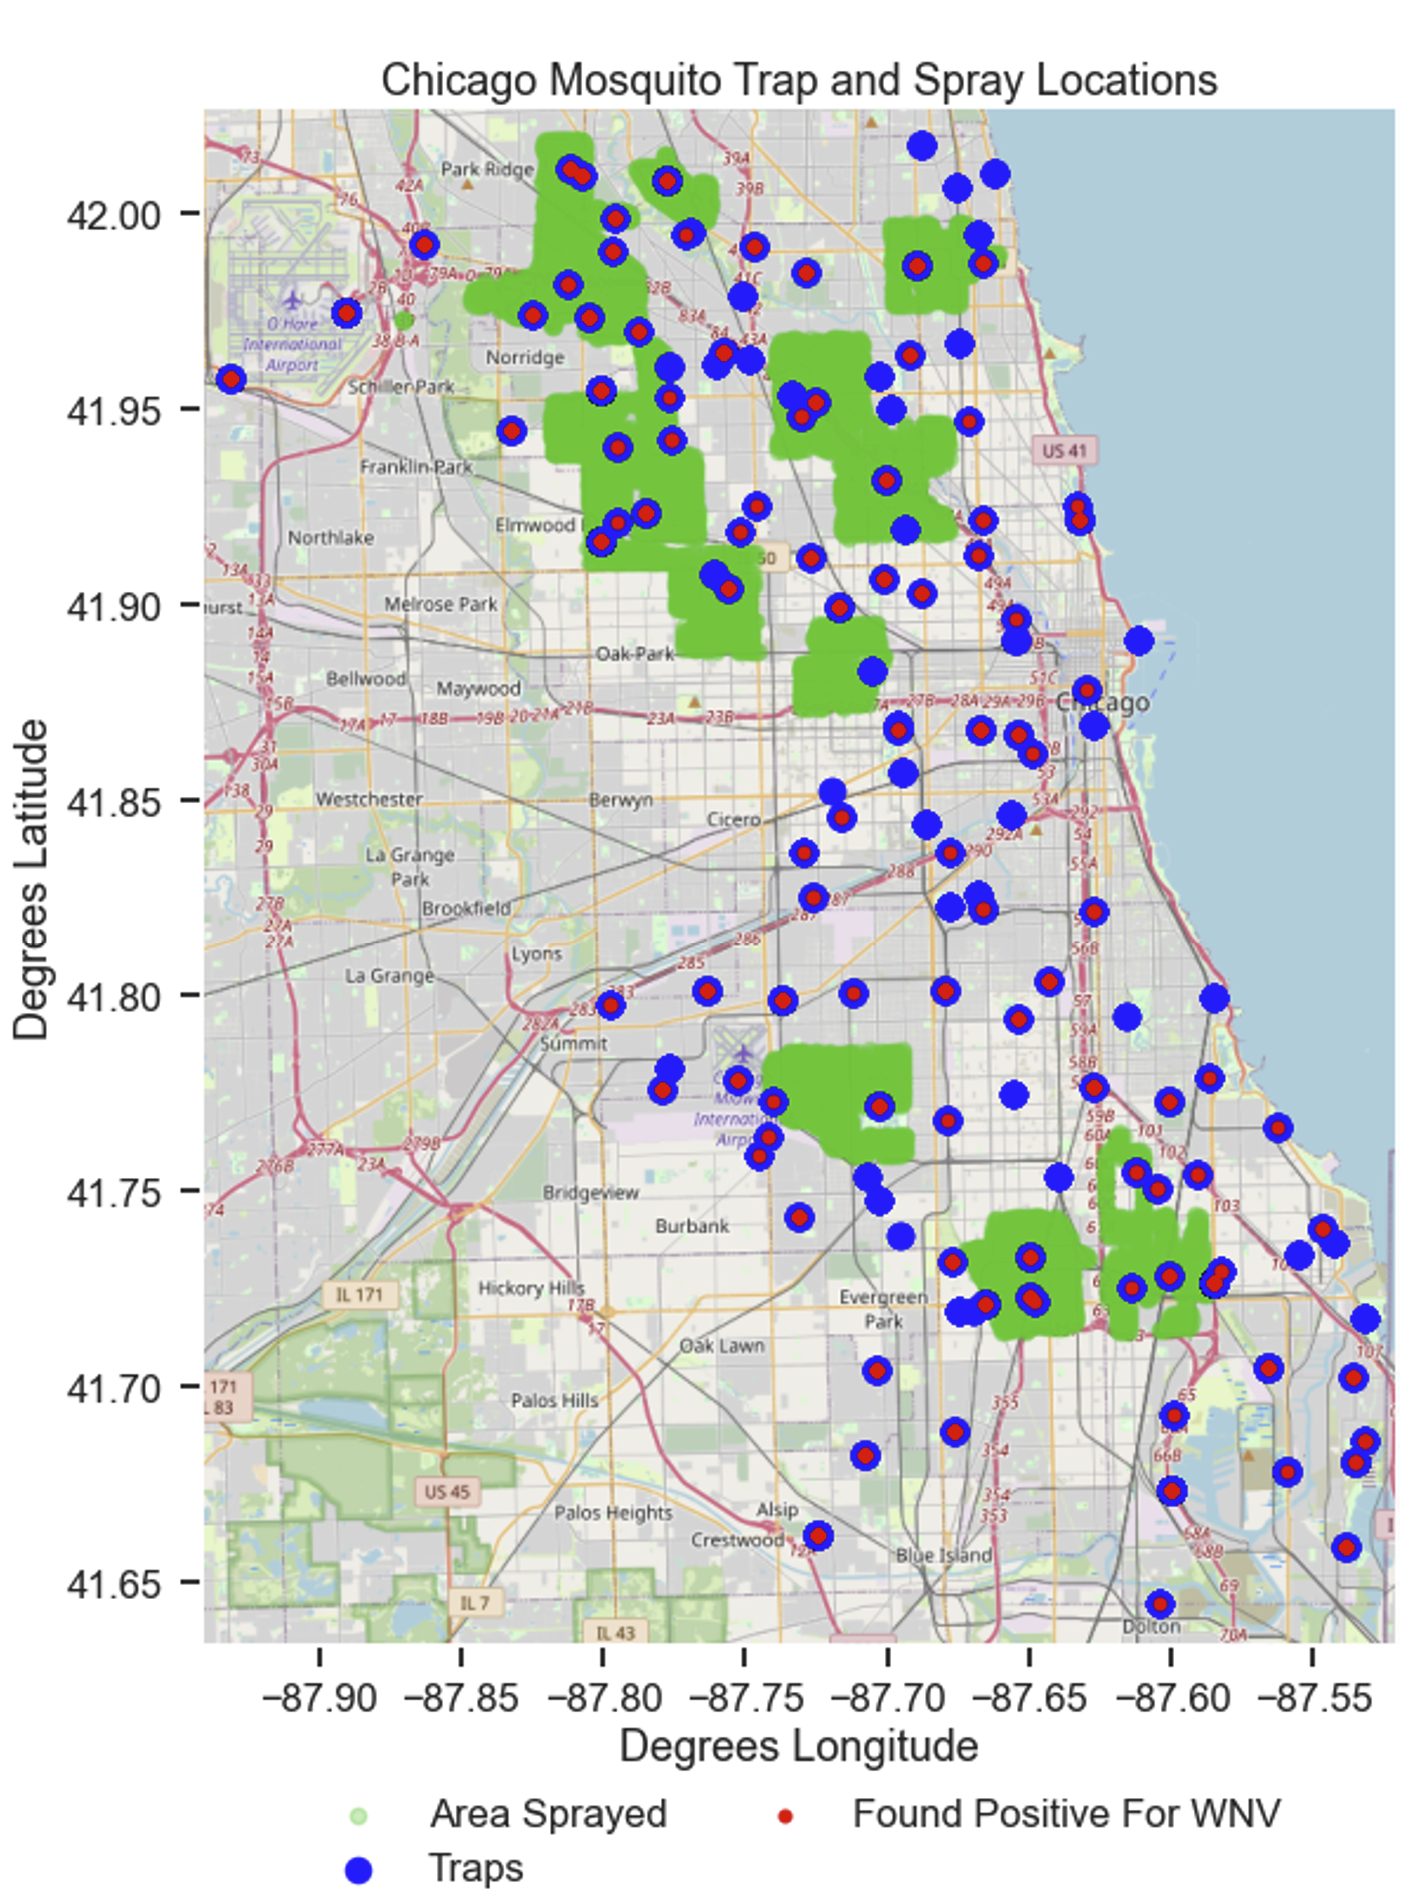
After loading all of the CSVs into Python, the next step was to make the data usable together. In order to make the weather data relevant to the trap data, each trap had to be assigned to its closest weather station. As the coordinates for both the weather stations and the traps are provided, the Haversine Formula (which finds the distance two coordinates are from each other on a sphere of a given radius) was used to determine the closest weather station to each trap and then matched each trap up with its relevant weather. With this calculation completed, the following maps were then created in Python to visualize these points.
Initial Analysis
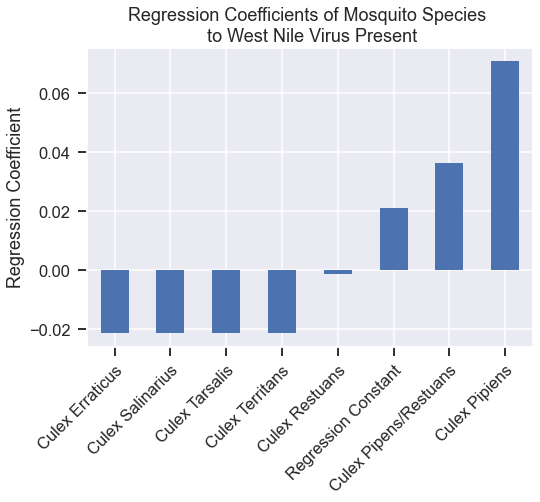
With weather and trap data established, it was necessary to begin to learn more about mosquitoes themselves and how they behave. The first step here was to see which mosquito species was associated with more West Nile Virus cases. To do this, a simple regression was performed and it was found that Culex Pipiens and Culex Pipiens/Restuans had a much higher coefficient of West Nile cases. In researching online, this is because West Nile Virus is an avian flu and Culex Pipiens has a much higher preference to live near and feed on birds than other species of mosquitoes.
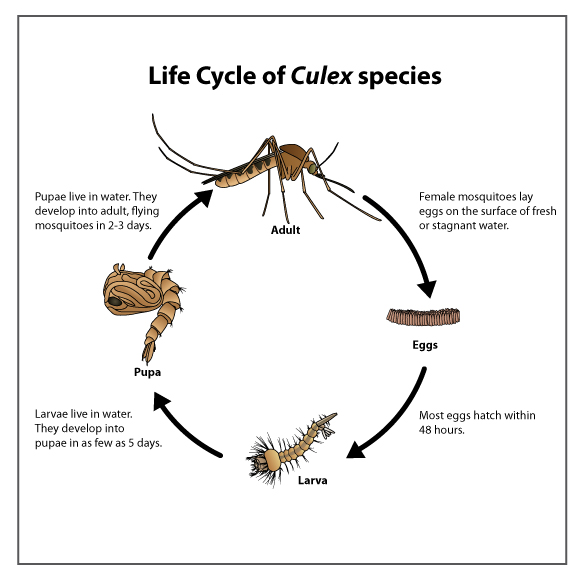
To better understand mosquito populations, it is important to first understand the mosquito life cycle and behaviors. Female Culex mosquitoes law 100-300 eggs on water surfaces such as barrels, ponds, pools, creeks, and marshy areas. Within 48 hours, larvae hatch from these eggs. They feed primarily on microorganisms, algae, and plant debris for 5 days and then turn into pupae. 2-3 days later, a fully formed mosquito emerges from pupae. These adult mosquitoes can fly up to 2 miles. Male Culex mosquitoes feed solely on plant nectar while female Culex mosquitoes require blood for egg production.
Weather patterns and their effects on mosquitoes
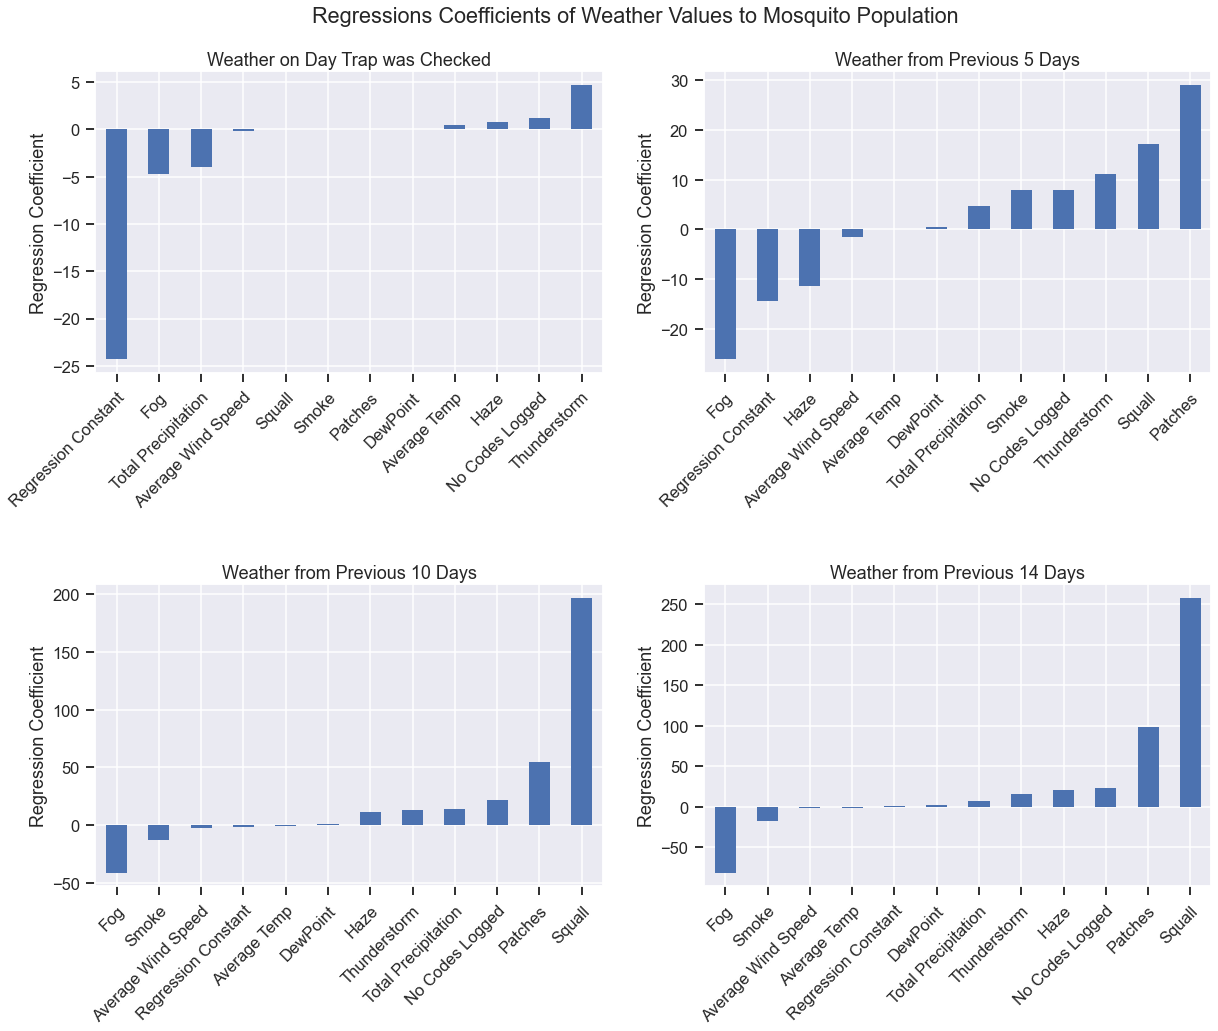
Taking in mind the life cycle and behaviors of mosquitoes, it's clear that only viewing the weather on the day the trap was checked isn't going to be very helpful. In fact, since the traps are only checked once per week, looking at the weather for only one day may lead to some incorrect conclusions. Knowing this, new columns were added for rolling averages of weather patterns for the past 5, 10, and 14 days. This required the "CodeSum" column to be split apart and identified. This column originally gave METAR weather codes in a single column separated by a space (i.e. "BG HZ RA SQ" - meaning that day had mist, haze, rain, and a squall). After splitting apart this column, new columns for 5, 10, and 14 day averages were created for each time the trap was checked. With these new columns, a regression was able to be performed to explore the relationships between mosquito population and weather. In the top left chart, as expected, weather on the day the trap was checked has very little bearing on population: the regression constant is by far the most impactful value - meaning that none of the other values were truly impactful. By the time the 14 day average weather is checked, however, it's clear that squalls, patches (of clouds), and fog appear to be truly impactful on mosquito population. This meets expectations as squalls can lead to excessive standing water - perfect for mosquito growth.
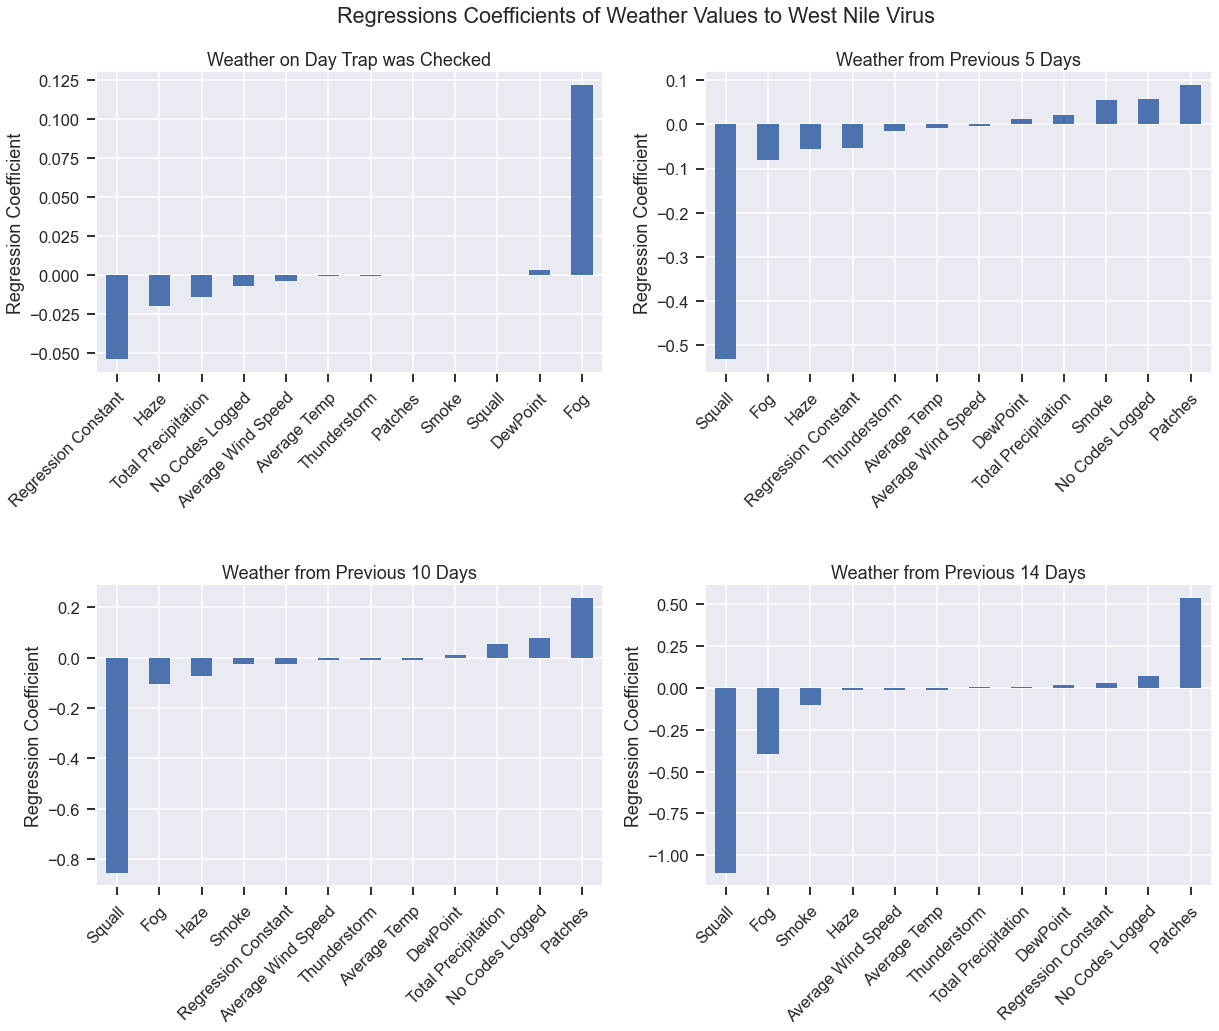
Performing the regression calculation on how weather affects West Nile Virus prevalence also leads to interesting findings. When dealing with the prevalence of West Nile Virus, it's not only the mosquito population that has to be accounted for - it's also the behavior of birds and how much those mosquitoes will interact with them. Here we see that squalls actually seem to deter West Nile Virus while appearing to increase mosquito population. Again, this is likely more of a function of how birds react to weather than it is about mosquitoes.
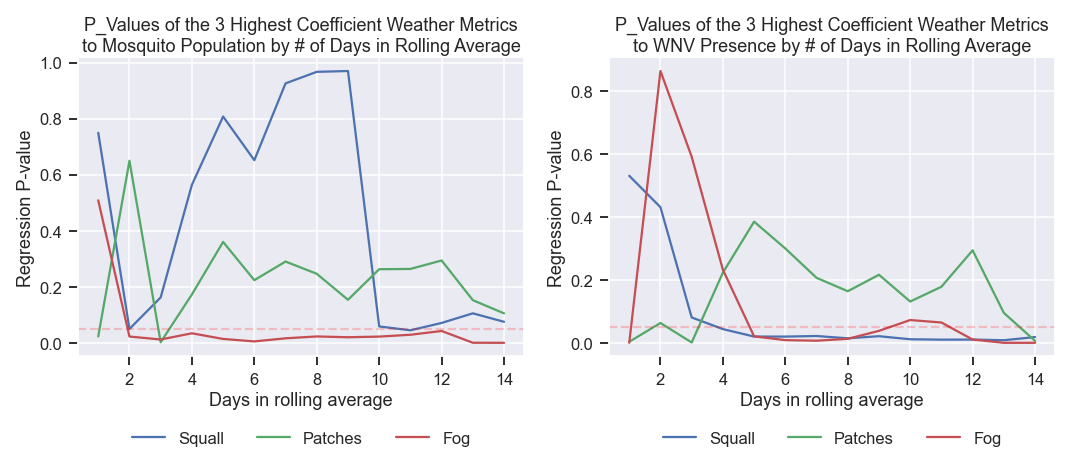
Now that the regressions were performed and most impactful weather patterns are identified, it's important to measure the P-Value of these patterns. Since 5, 10, and 14
day averages were chosen somewhat at random, it was necessary to design a chart that would show each pattern's P-Value for each day in that range to identify exactly
when those patterns were statistically significant. An exciting part of these graphs is on the left where it's shown that, as expected, squalls don't have an actual impact on mosquito
population until 11 days have elapsed. Given that mosquitoes grow from eggs laid on stagnant water to fully formed mosquitoes in 10 days, this makes a lot of sense.
In the right graph, it's clear that squalls and fog are statistically significant when averaged over a rolling period of 5+ days. Here, however, squalls are shown to be statistically significant at
reducing West Nile Virus prevalence - not increasing it.
Pesticide spraying and its effects on mosquitoes
After exploring the relationship between weather conditions and their influence on both mosquito populations and West Nile Virus prevalence, it is essential to also investigate how pesticide spraying influences these dependent variables. In 2011 and 2013, the City of Chicago undertook a series of 13 pesticide sprays to attempt to cull mosquito populations and reduce the risk of West Nile Virus infections.
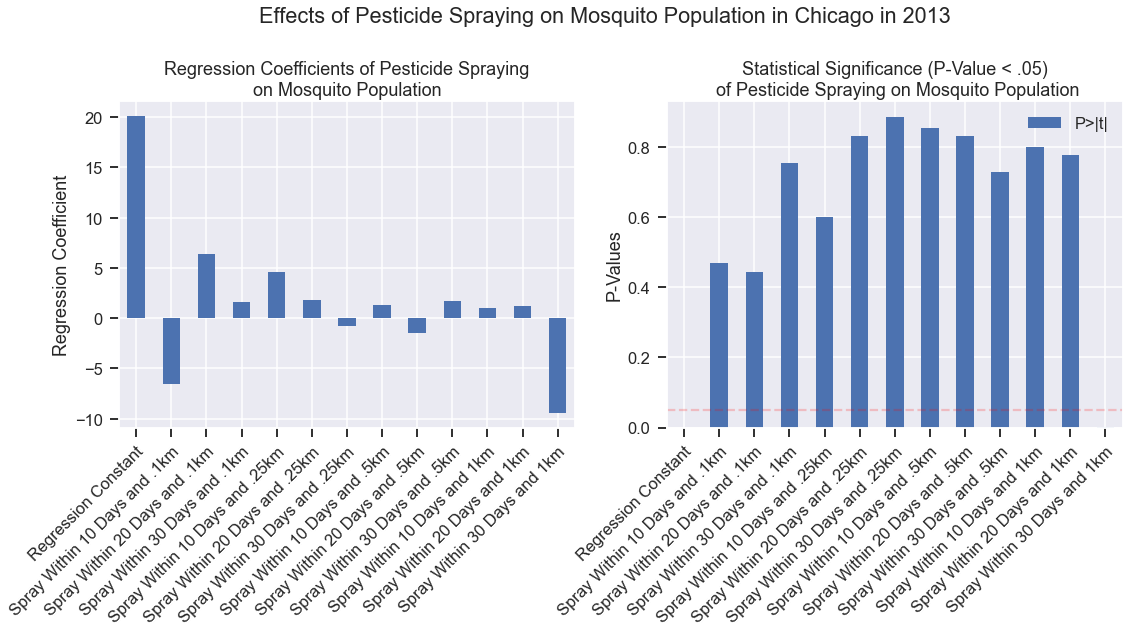
With the GPS coordinates of each spray location known, the Haversine Formula is again used to determine how close a spray is to the nearest mosquito trap. From here, columns are added to each trap inspection to verify if a pesticide spray has occurred within the last 0.1-1.0km and within the last 10-30 days. With these factors known, it's possible to then perform a regression on each instance to test when and where pesticide spraying is the most effective. As shown in the chart below, the largest regression value belongs to the regression constant which means that none of these values had a large effect. That said, when a trap was found to have had a spray within 30 days and 1km, pesticide spraying was shown to be statistically significant at reducing the number of mosquitoes present.
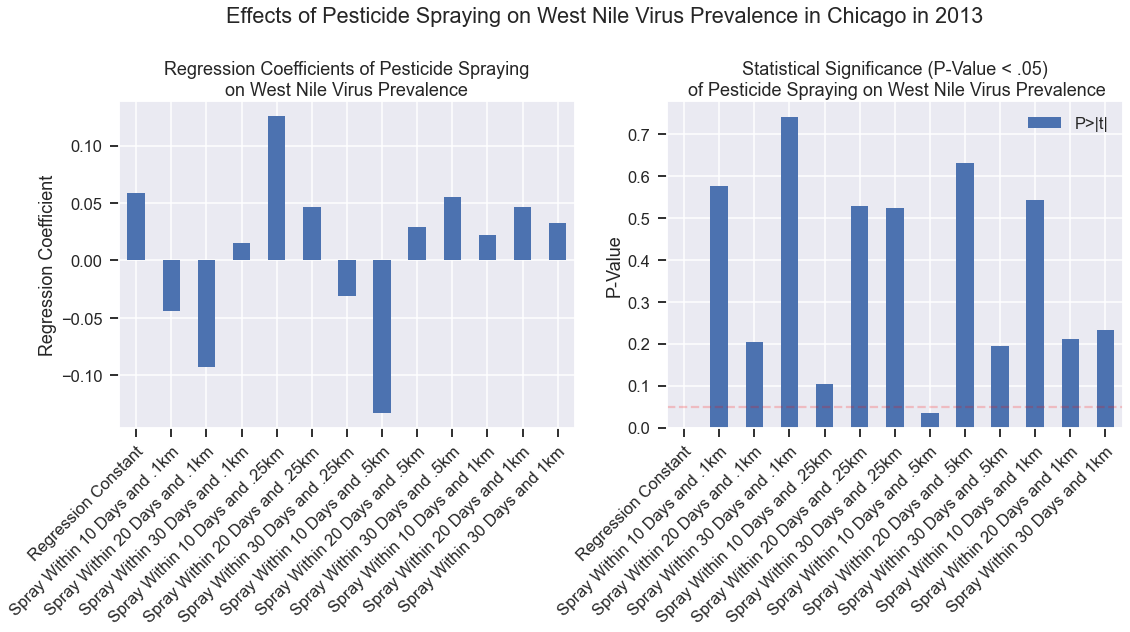
Pesticide spraying was also found to be statistically significant at reducing West Nile Virus prevalence when it was within 10 days and 0.5km of a trap - this time with a value more than twice the regression constant.
Takeaways
This data, in total, identifies several key takeaways:1) Culex Pipiens mosquitoes are the primary drivers of West Nile Virus infections in Chicago.
2) Squalls were found to significantly increase mosquito population levels after about 10 days. Fog was also found to reduce mosquito population levels from 2 days through the maximum measured time.
3) Squalls were also found to significantly reduce the amount of West Nile Virus prevalence in mosquito traps. It is hypothesized that this is due to its effects on bird behavior.
4) Pesticide spraying was found to be effective at lowering mosquito population in areas within 30 days and 1km of a spray.
5) Pesticide spraying was also found to be effective at lowering West Nile Virus prevalence in areas within 30 days and 1km.
Tableau Presentation of this data
- © Untitled
- Design: HTML5 UP