Greening Research In Tacoma
Data Cleaning and Standardization
This data collection project began with volunteer-collected temperature data and combined data from multiple different sources into a large repository where it could be analyzed together. The first step of this project was to clean and standardize all the data collected during the volunteer data collection event hosted in August of 2022. During this event, volunteers placed unshielded temperature sensors at the base of each of the electrical poles in Tacoma that had a shielded temperature logger installed on it.
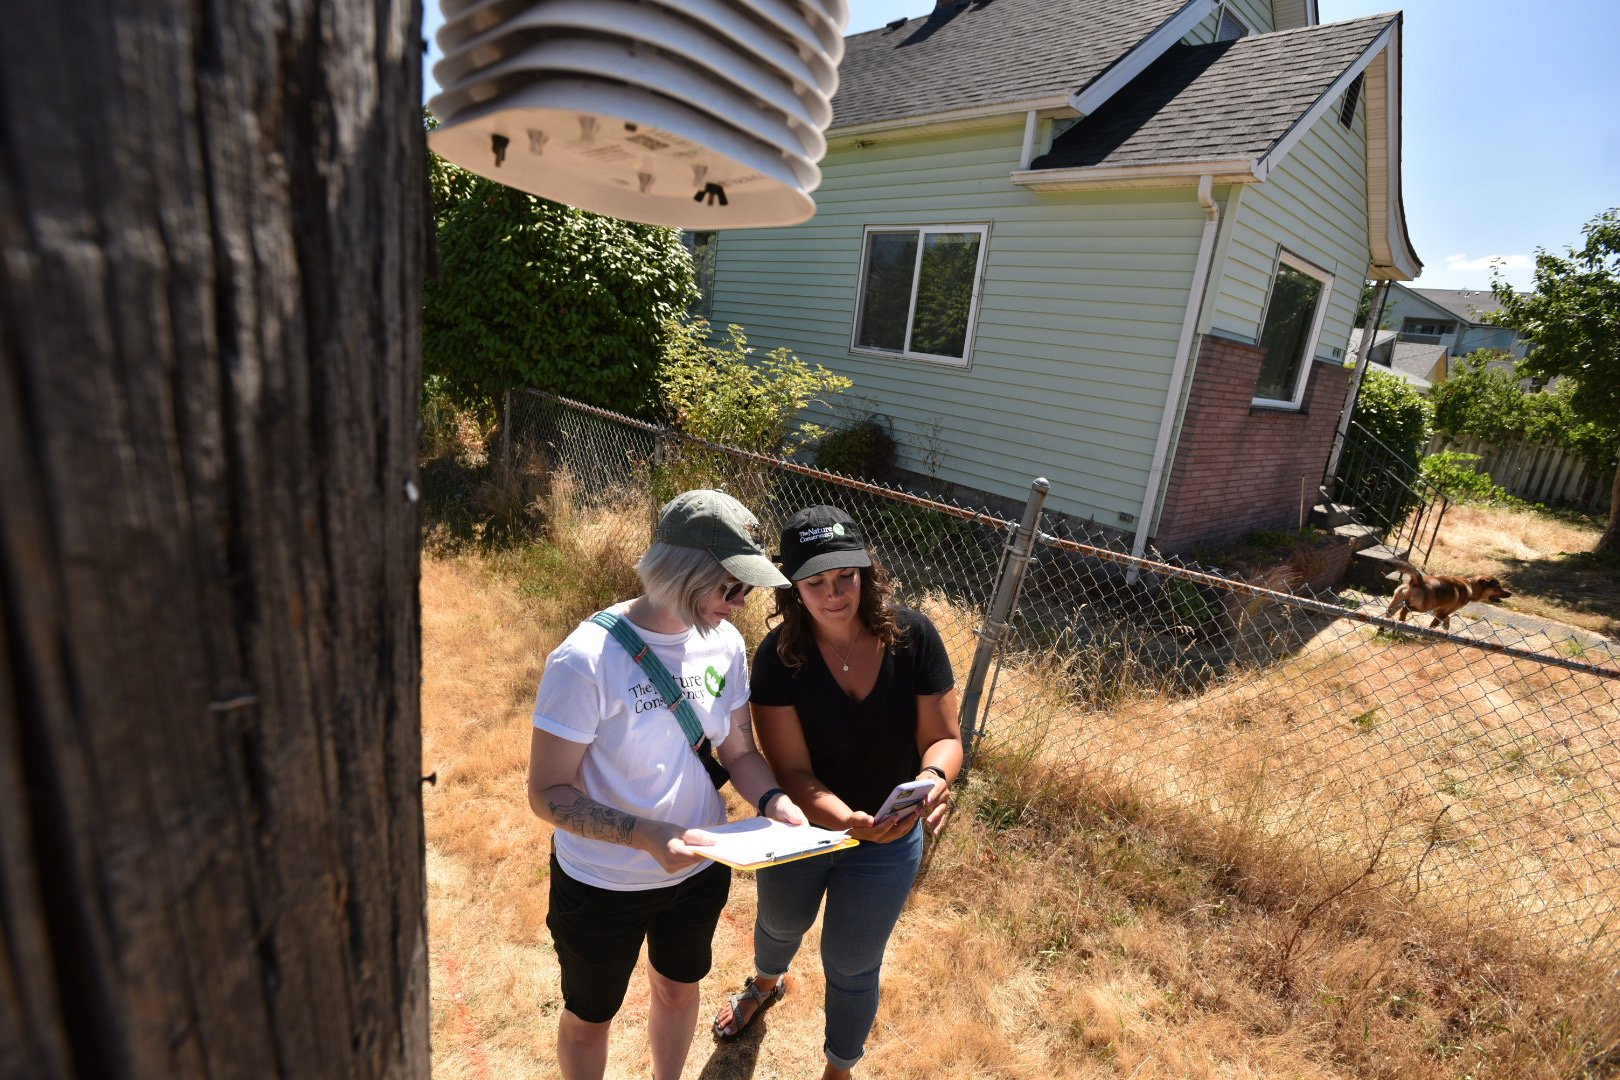
Photo by Hannah Letinich/TNC
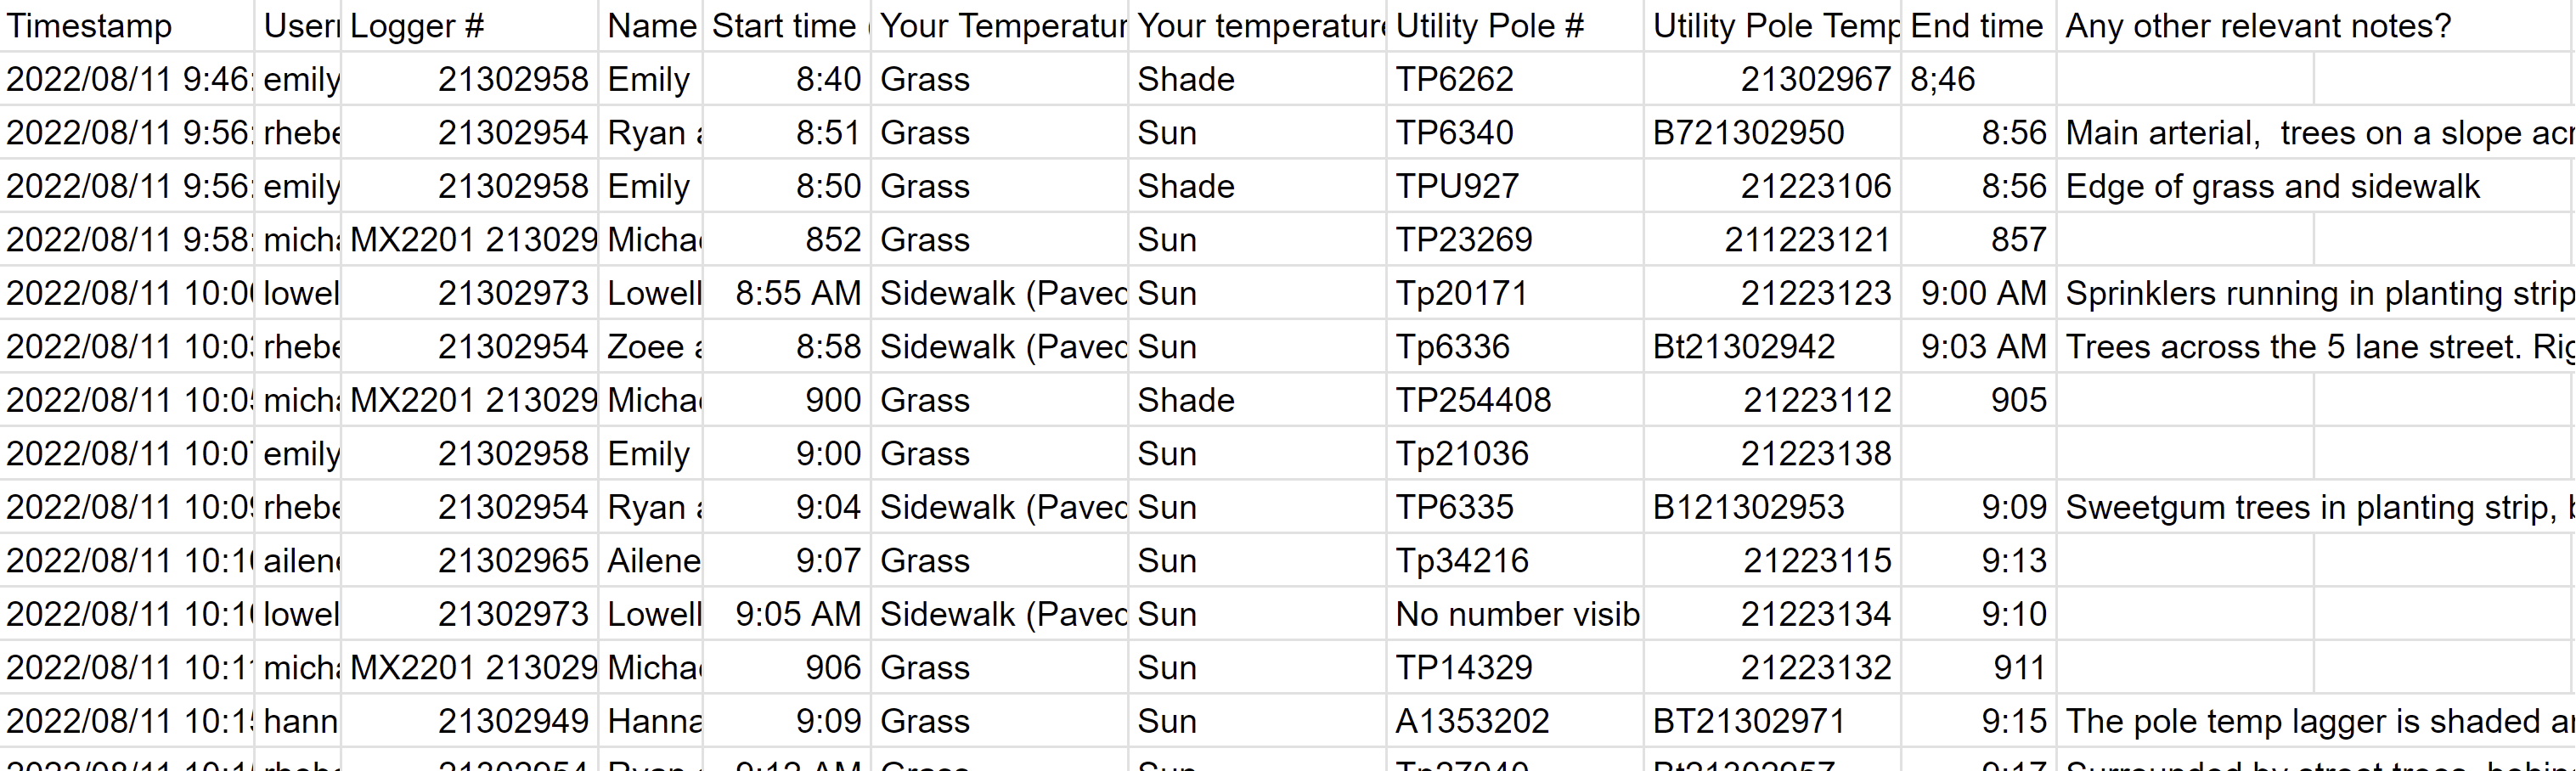
The data collected from the volunteer event was extraordinarily messy. As evidenced in the CSV screenshot below, there were many immediately noticeable issues in standardization - the worst offender being start and stop times. Each carried temperature logger was placed on the ground for 5 minutes to allow it to stabilize. Volunteers were then asked to record the beginning and end of these intervals manually in a simple text input field. Volunteers also recorded electrical pole numbers and the identification number of both the carried and mounted temperature loggers.
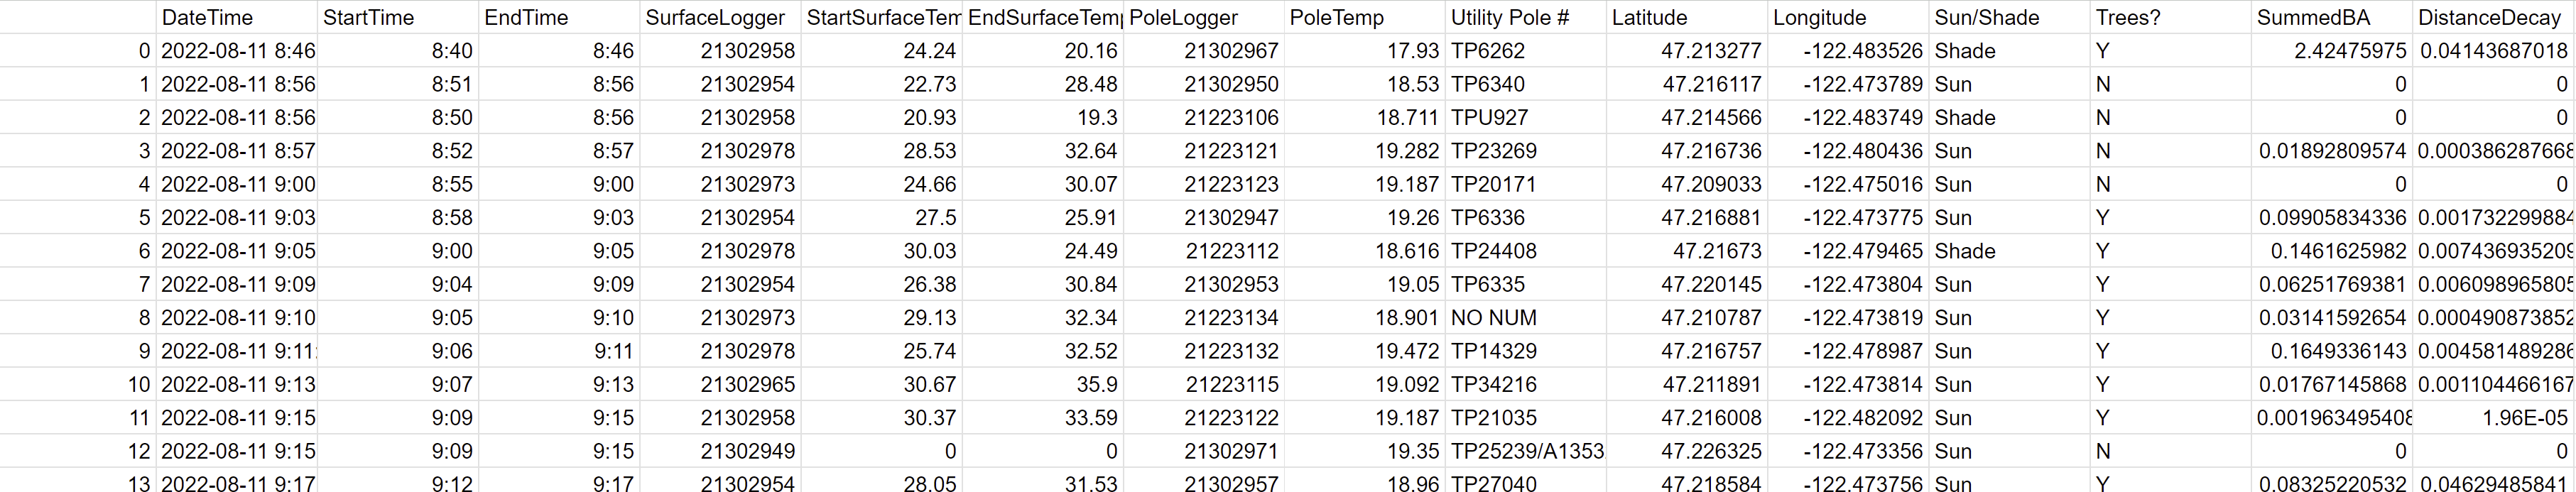
After standardizing all volunteer inputs and cross referencing the submitted logger/pole identification values to ensure correct data, the next step was to combine the actual temperature data with the collected data showing when and where the temperatures were to be referenced. Now that the logger identifications were standardized, this was a fairly straightforward process of pulling the relevant temperature values from one CSV to the newly created DataFrame. Next, mounted logger values had to be combined into the DataFrame from individual CSV files. This function used the name of the pole from the original data to open the correct pole CSV, identify the corresponding time, and add that value to the new DataFrame.
From here, the last step before analysis was to add additional tree and location data. This data includes specific coordinates, tree types, and tree distances. After adding these, a calculation is performed using the distance of trees to the temperature logger as well as tree canopy density based on tree species and Diameter at Breast Height.
Data Analysis
For the initial data analysis, it was important to discover exactly what data was collected, how it could be used, and what the individual shortfalls were. To begin this task, the first thing was to obtain a map of each of the logger locations and show what temperature data we had received from each. In looking at the temperature data recorded, the most immediately noticeable fact is that the pole loggers had much more consistent temperature readings. This was expected as the pole loggers had radiation shielding and the surface loggers did not - leading to much higher temperature fluctuations from things like direct sunlight, being held by volunteers, or being in a pocket.
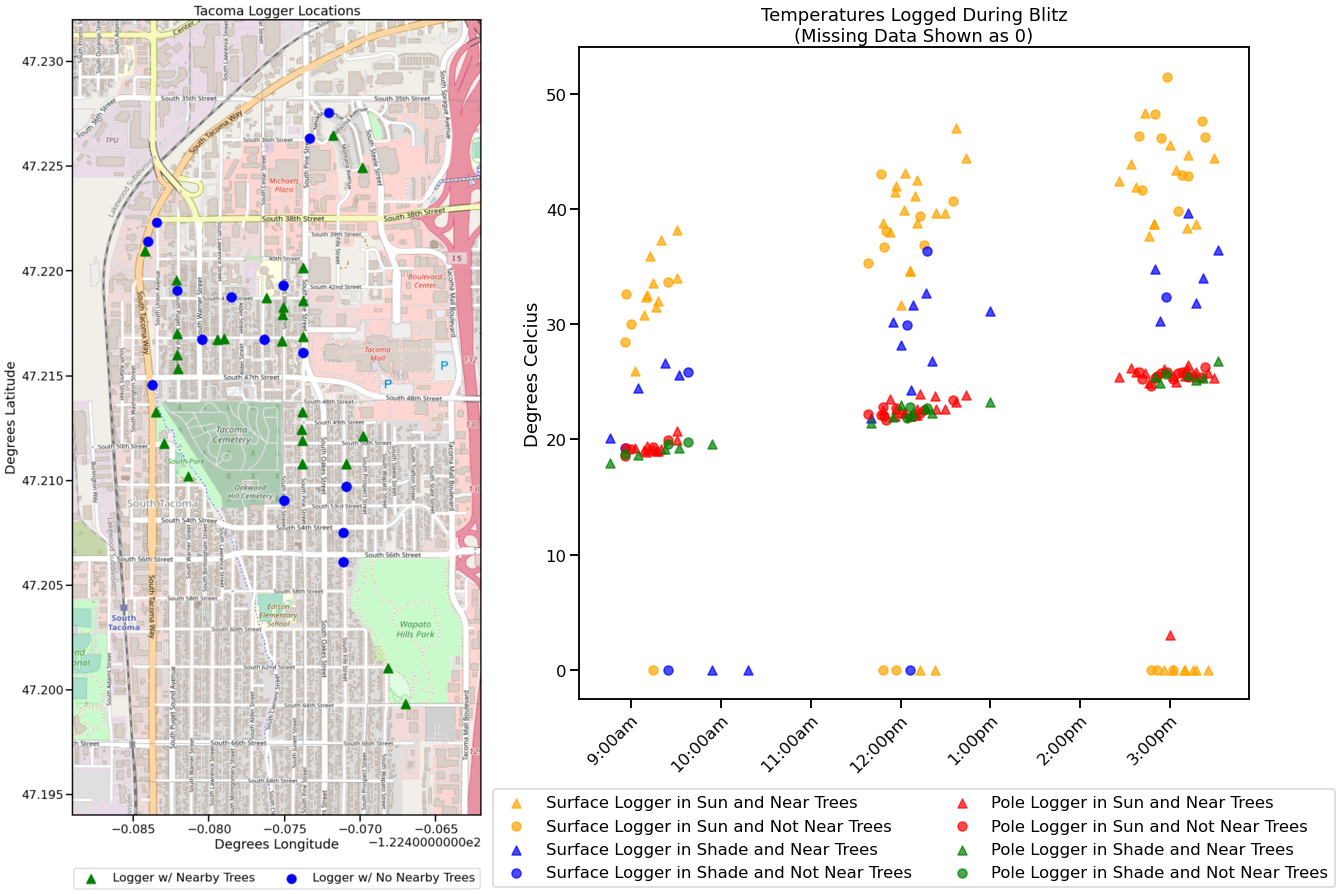
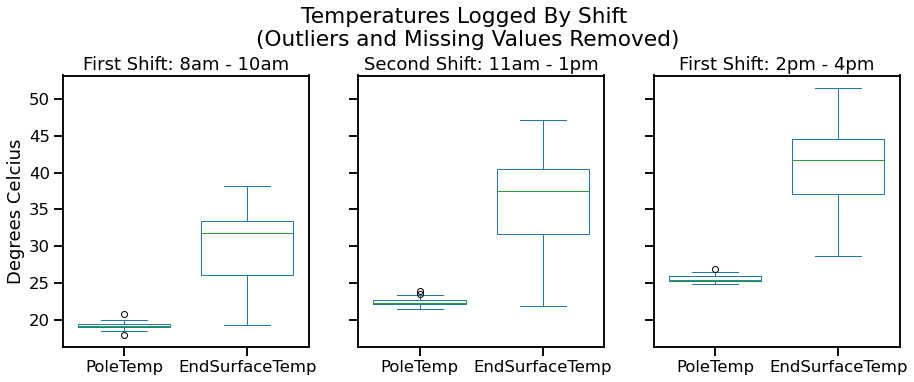
Visualized another way, its clear that the spread of temperatures in the surface logger readings needed to be addressed. Initially a calculation had been performed to take the average temperature from each surface logger for the 5 minute period that it was being recorded. As it became clear that the loggers were settling into a "truer" reading, the decision was made to use the "end" time values as they were likely the most accurate. As shown here, there was still a massive disparity in temperature values.
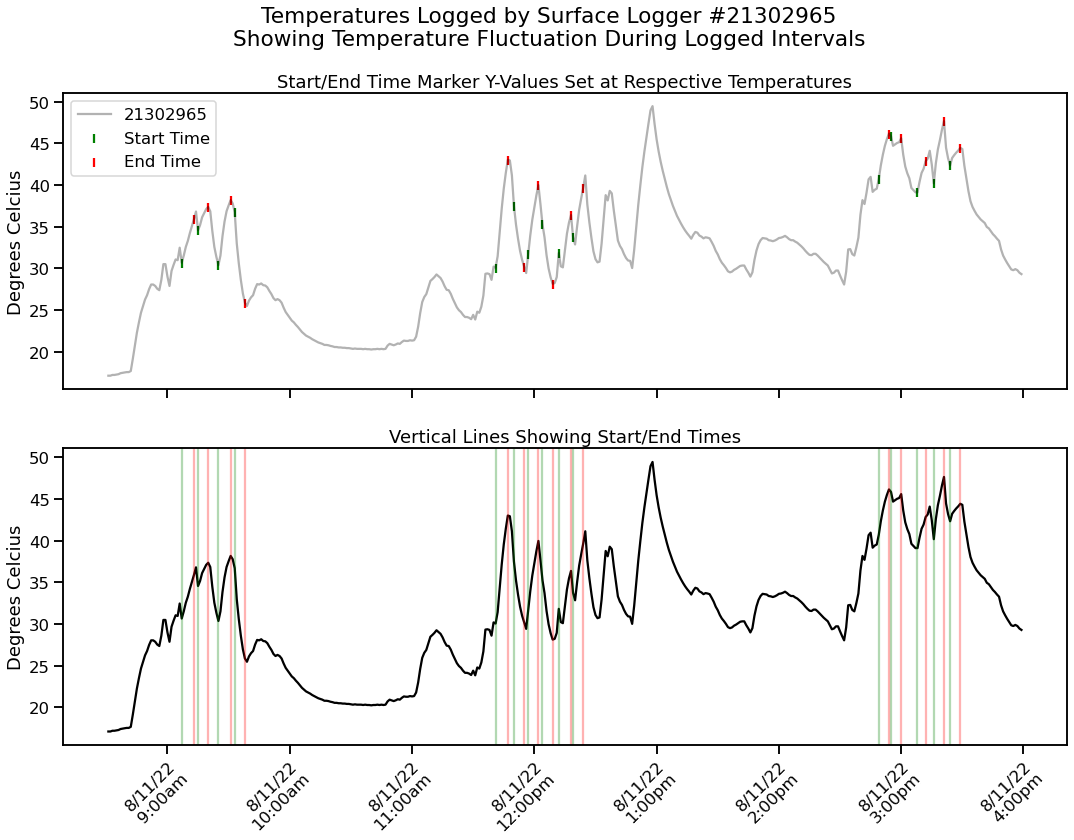
With this disparity in consistent values, the next step was to examine individual minute-by-minute readings to see where the problem lay. This next chart visualizes the full day's worth of temperature readings from surface logger #21302965 (chosen at random) and overlays when the recorded start and stop times occurred. This chart makes the issue extremely plain. In each interval the temperature jumps up or down a substantial amount, but never truly stabilizes - meaning that even the end values were woefully inaccurate. Even during scheduled "shift" breaks from 10-11am and 1-2pm, its clear that these loggers take a long time to stabilize without a radiation shield.
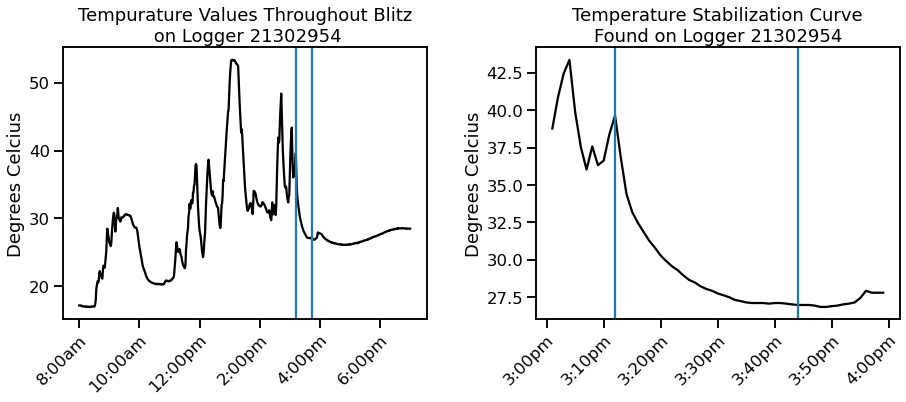
However, while the vast majority of values never stabilized, we still had values from 7 different surface loggers of the same type, on the same day, and the same weather conditions. With this known, all the surface loggers were searched to see how long it truly takes to stabilize the temperature. Surface logger #21302954 was found to present a beautiful stabilization curve that could be extrapolated from. Assuming a consistent rate of stabilization curve, if a temperature changed a large amount it would still have a fair amount to go - while if the temperature moved only a small amount, the final temperature could be expected to be much closer. So if a logger temperature started at 22.73C and ended at 28.48C, it could be expected to stabilize at 32.58C. And if it started at 20.93C and ended at 19.30C, it could be expected to stabilize at 17.65C.
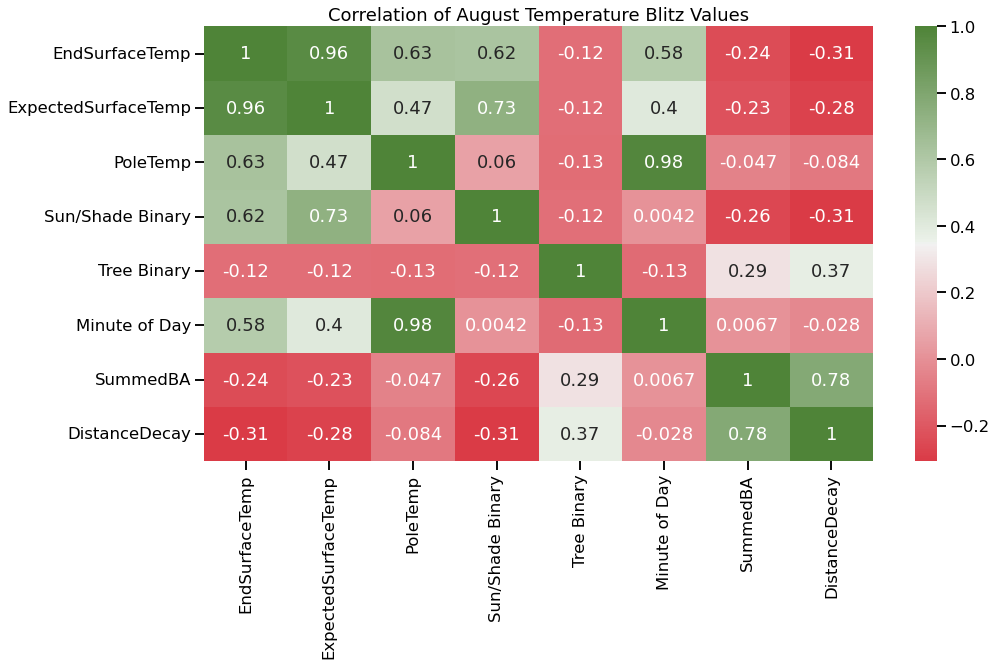
Ultimately, while additional correlations and regression analysis were still performed with this data and available in the full analysis linked at the top of the page, the "correct" temperature readings cannot be fully proven or made usable for much more than speculation. With this known, focus was instead pivoted to plan for a subsequent event. In planning this event, much effort was made to mitigate data collection issues present with the initial run. A new form was designed to standardize inputted times, simplify pole and logger identification to minimize typos, and provide triple redundancy to ensure readings were matched to the correct location. Start/end time intervals were increased to 10 minutes, and, most importantly, solar radiation shields were affixed to all carried surface loggers. This subsequent event was held in May of 2023 with great success and ideally its analysis will appear on this portfolio soon.